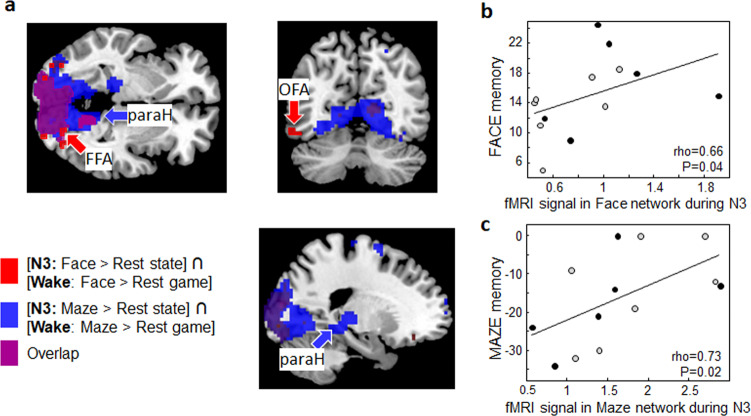
Fig. 4. Game-specific reactivation during N3 and subsequent memory (N = 13).
a In red, brain regions more activated for Face than Rest brain state during N3 sleep, and also recruited during the execution of the task at wake (blocks of Face vs. Rest; conjunction analysis). This network included, among other regions, early visual cortices and the fusiform and occipital face regions. In blue, brain regions more activated for Maze than Rest brain state during N3 sleep, and also recruited during the maze game (blocks of Maze vs. Rest; conjunction analysis). This network included, among others, early visual cortices, the hippocampus and parahippocampal cortex. In purple, overlap between those face and maze reactivation networks during sleep. b Correlation between activity in the face network (red regions in a) during N3 and memory performance for the face game. c Correlation between activity of the maze network (blue regions in a) during N3 and memory for the maze game. Gray dots for participants who won the face game; black dots for participants who won the maze game. FFA fusiform face area; paraH: parahippocampus, OFA occipital face area. For memory performance measurements, see “Methods”. Source data are provided as a Source Data file.

