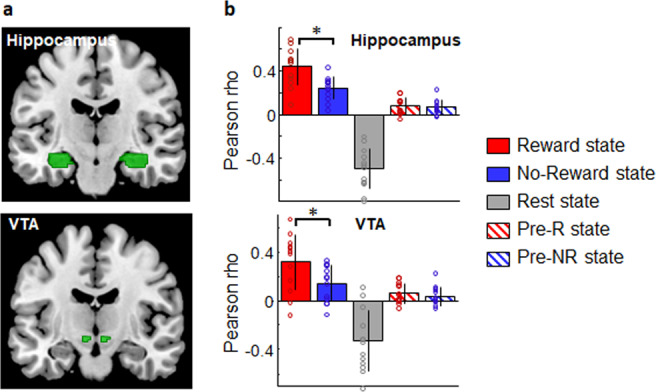
Fig. 5. Reward-related reactivation in hippocampus and ventral tegmental area (VTA) during sleep (N = 13).

a Anatomical masks used as regions of interest (in green). b Mean correlation values for all participants between the time courses of the regions of interest and the different brain states. Asterisks indicate p < 0.002 for the hippocampus and p < 0.02 for the VTA for the Reward vs. No-Reward comparison, for two-sided post-hoc t tests. Error bars represent SD (Standard Deviation); dots represent individual data. Repeated measures ANOVA with post-hoc test (planned comparison). Source data are provided as a Source Data file.
