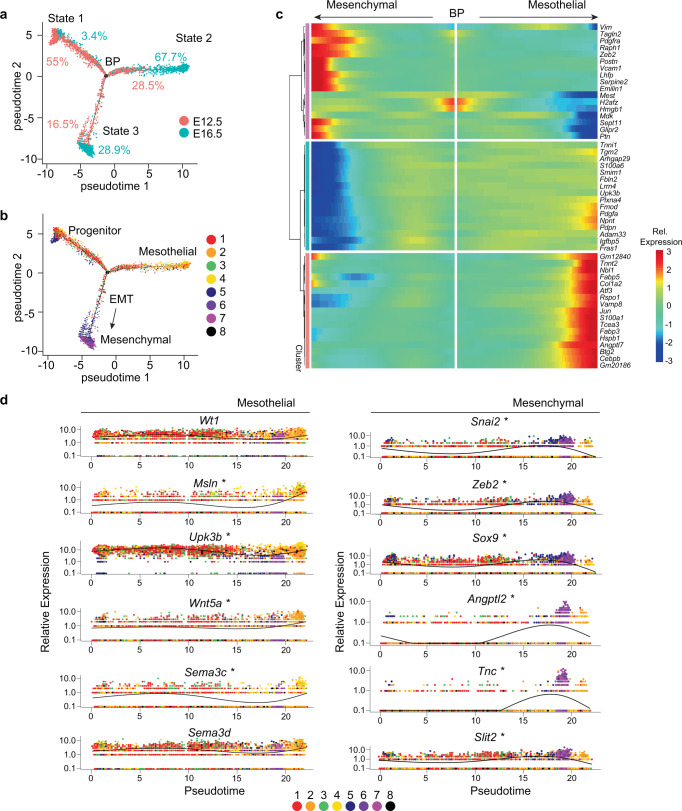
Fig. 2. Epicardial-to-mesenchymal transition restricts expression of secreted ligands genes.
a Monocle-generated pseudotime trajectory reveals the composition of three cell states based on the developmental stage (%). Cells in state 1 are at the beginning of pseudotime. Cell states 2 and 3 diverge at a common branchpoint (BP). b Pseudotime trajectory reveals the composition of cell identity within cell states. State 1 contains epicardial progenitor cells from Cluster 1 (C1)/C3. State 2 is populated by mesothelial cells from C2/C4. State 3 emerges from a common progenitor through a transient state characterized by cells in C5 actively undergoing EMT and culminates in mesenchymal cells of C6/C7. c Hierarchical clustering visualization of genes that define pseudotime states. Relative (Rel.) expression represents the scaled expression of rlog normalized data. d Pseudotime-dependent genes augmented in mesenchymal versus mesothelial cells. Cells are colored according to cell cluster identity. *Genes with significant correlation with pseudotime state.

