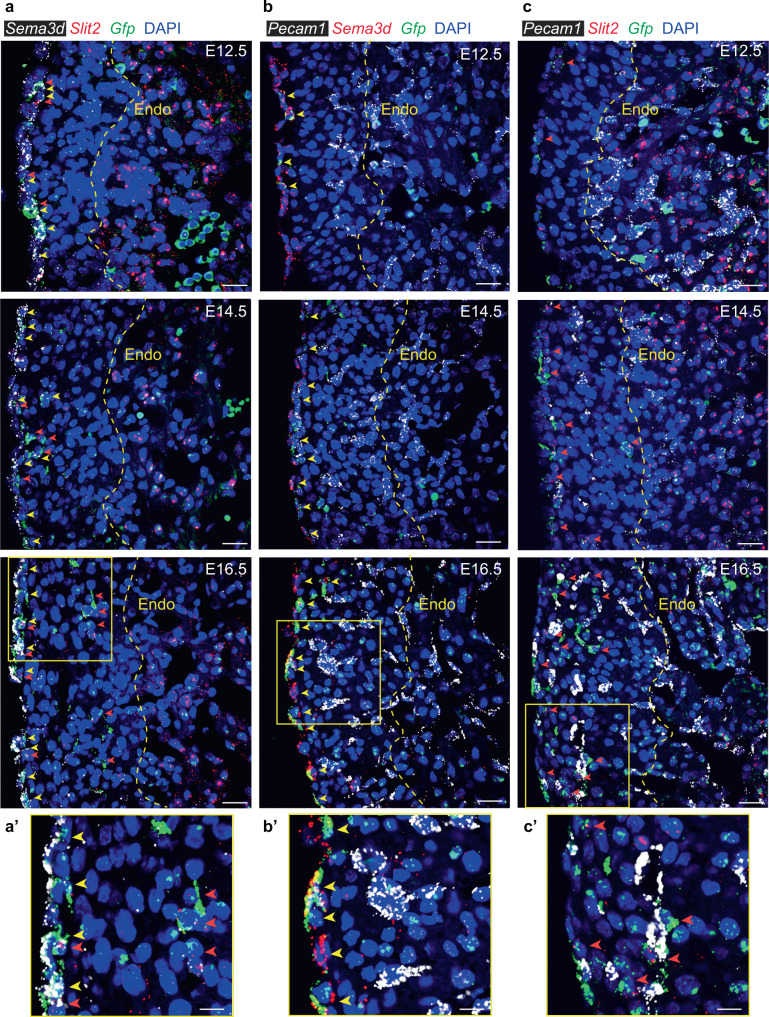
Fig. 3. In situ analysis confirms the expression and localization of vascular guidance genes in epicardium-derived cells.
a FISH using probes against Gfp (green) to detect epicardium-derived cells and Sema3d (white) or Slit2 (red) reveals diverging localization of vascular guidance cues within the epicardium and interstitium between embryonic (E)12.5 and E16.5. a′, 3× zoom of E16.5. b Expression of Sema3d (red) in Wt1 lineage-derived cells (Gfp+, green) relative to Pecam1+ (platelet endothelial cell adhesion molecule-1, white) endothelial cells. b′, 3× zoom of E16.5. c Expression of Slit2 (red) in Wt1 lineage-derived cells (Gfp+, green) relative to Pecam1+ (white) endothelial cells. c′ 3× zoom of E16.5. Yellow arrowhead, Gfp+/Sema3d+ cells. Orange arrowhead, Gfp+/Slit2+ cells. Dashed yellow line represents the endocardium–myocardium border. DAPI staining was utilized to visualize nuclei (blue). Scale bar, 20 μm. Scale bar 3× zoom, 10 μm. Endo endocardium.

