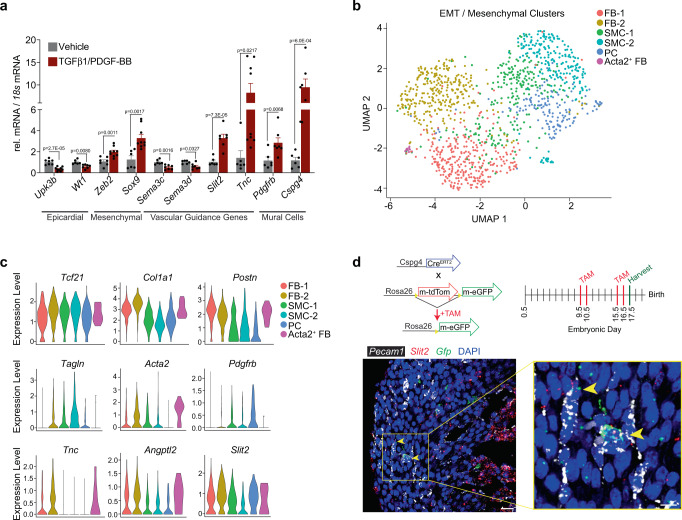
Fig. 5. Vascular guidance cues are differentially expressed upon in vitro induction of EMT.
a Primary epicardial cells were cultured ± TGFβ1 [10 ng/mL] and PDGF-BB [20 ng/mL] to induce EMT. Relative expression of genes encoding axon guidance cues was evaluated by qRT-PCR, along with markers of epicardial, mesenchymal, and mural cells. n represents samples isolated from independent embryos, which were analyzed over 2 experiments. Vehicle n = 6 for Sox9, Sema3c, Tnc and n = 7 for Upk3b, Wt1, Zeb2, Sema3d, Slit2, Pdgfrb, Cspg4; and TGFβ1/PDGF-BB n = 7 for Wt1, Sema3c, Sema3d, Slit2, Pdgfrb, Cspg4 and n = 9 for Upk3b, Zeb2, Sox9, Tnc. Data are presented as mean values ± SEM. Statistical significance was determined by a two-sample unpaired Student’s t-test. b Seurat was used to re-cluster cells undergoing EMT (cluster 5) and mesenchymal cells (clusters 6/7) defined in Fig. 1f. c Violin plots representing select genes associated with fibroblast or mural cell identity. Expression level represents log normalized expression. d Experimental strategy for lineage tracing vascular mural cells in Cspg4CreERT2;R26mTmG embryos. FISH was performed on hearts with probes directed against Gfp (green) and Slit2 (red) as demonstrated in low (left) and high (right) magnification images and relative to Pecam1+ (platelet endothelial cell adhesion molecule-1, white) endothelial cells. Yellow arrowheads, Slit2 expression in Cspg4 lineage-derived cells. Scale bar, 25 μm (left image) and 10 μm (zoom right image). DAPI staining was utilized to visualize nuclei (blue). Immunostaining was repeated independently 3 times with similar results. EMT epithelial-to-mesenchymal transition, TAM tamoxifen, FB fibroblast, SMC smooth muscle cell, PC pericyte.

