Figure 4.
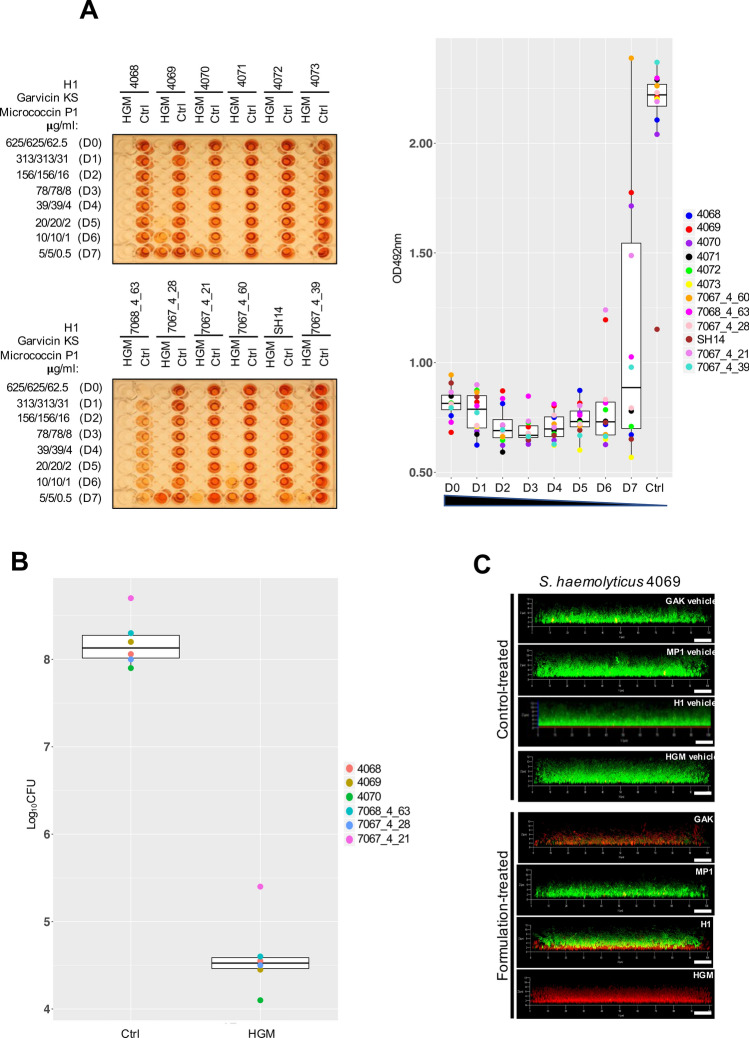
The tricomponent antimicrobial combination effectively inhibits the metabolic activity and viability of S. haemolyticus biofilm-associated cells in vitro. (A) The left panels show representative images of BOAT assays performed upon 24 h treatment with the tricomponent combination (HGM: H1, GarKS, MP1) for the indicated strains. The concentration (μg/ml) of the individual antimicrobials in the dilutions (dilution factors: D0 to D7) is indicated on the far left of the images. As controls, the assay was performed using the vehicles at their final concentrations (Ctrl). The development of red color indicates the retention of metabolic activity, and its quantification was performed by spectrophotometry at OD492. Metabolic activity values were plotted as a function of the dilution factor for the antimicrobial combination (right panel). Shown is the median distribution (thick line within boxes) and the degree of variability (amplitude of the box or inter quartile region (IQR)) of the metabolic activities for the indicated strains measured at increasing dilution factors (D0–D7). The boxplot components (whiskers and outliers) are displayed as specified in Fig. 3. Note that the treatment maintained the metabolic activitiy under detectable levels up to D6 for most strains. (B) The logarithmic colony formation unit (Log10CFU) was calculated after the BOAT assays were performed for the indicated strains. BOAT assays were performed as in (A), and the boxplot shows the median distribution of the Log10CFU values. The antimicrobial concentrations in the tricomponent combination were 625 μg/ml for H1 and garvicin KS and 62.5 μg/ml for micrococcin P1. The control was performed by using the antimicrobials vehicles at their final concentration. (C) The S. haemolyticus strain 4069 was allowed to form biofilms on glass-bottomed chambers for 24 h, prior to treatment with the indicated antimicrobials (lower set of panels) or the respective control-vehicles (upper set of panels) as detailed in (B). The biofilms were subsequently stained using the LIVE/DEAD biofilm staining kit and confocal microscope images were taken using a 63 × oil immersion objective. Scale bars correspond to 10 μm.

