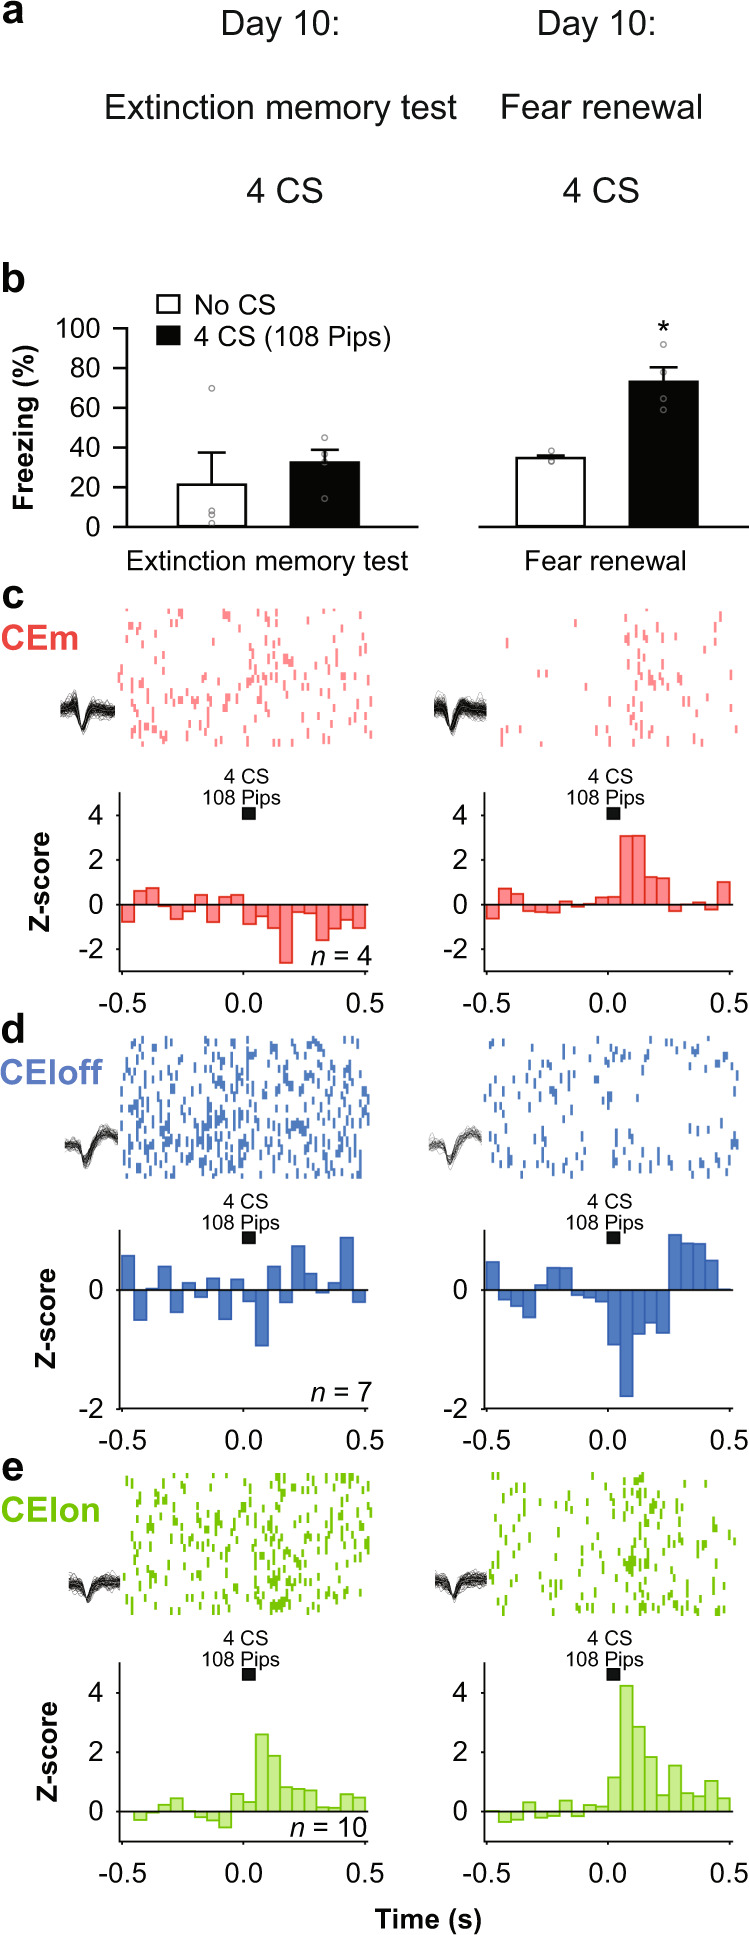
Fig. 3. Context-driven fear renewal reverses extinction-related CEA subpopulation activity.

a Behavioural protocol. CS: conditioned stimuli. b Behavioural data. B6 mice: n = 4; extinction memory retrieval, no CS: 21.4 ± 16.2%, CS: 32.5 ± 6.4%, fear renewal, no CS: 34.8 ± 1.2%, CS: 73.0 ± 7.3%, blocks of 4 CSs. One-way repeated-measures ANOVA F(3,9) = 8.5, p = 0.005 followed by post hoc Bonferroni t-test vs. CS block during extinction memory, p = 0.015. Bar plots are expressed as means ± SEM. Circles are freezing values of individual mice. c Raster plots and corresponding spike waveforms of a representative CEm unit (top). Normalized and averaged population peri-stimulus time histograms (bottom). CEm neurons: n = 4 units from 1 mouse; z-score, extinction memory retrieval: −0.79 ± 1.59, fear renewal: 3.08 ± 1.06, blocks of 4 CSs. Paired student t-test, two-sided, p = 0.039. d Raster plots and corresponding spike waveforms of a representative CEloff unit (top). Normalized and averaged population peri-stimulus time histograms (bottom). CEloff neurons: n = 7 units from 2 mice; z-score, extinction memory retrieval: −0.04 ± 0.61, fear renewal: −0.94 ± 0.40, blocks of 4 CSs. Paired student t-test, two-sided, p = 0.041. e Raster plots and corresponding spike waveforms of a representative CElon unit (top). Normalized and averaged population peri-stimulus time histograms (bottom). CElon neurons: n = 10 units from 2 mice; z-score, extinction memory: 1.28 ± 0.41, fear renewal: 2.13 ± 0.37, blocks of 4 CSs. Paired student t-test, two-sided, p = 0.034. All individual neurons of each CEA population had significant z-score values upon CS presentation (4 CSs during fear renewal). Source data are provided as a Source data file.
