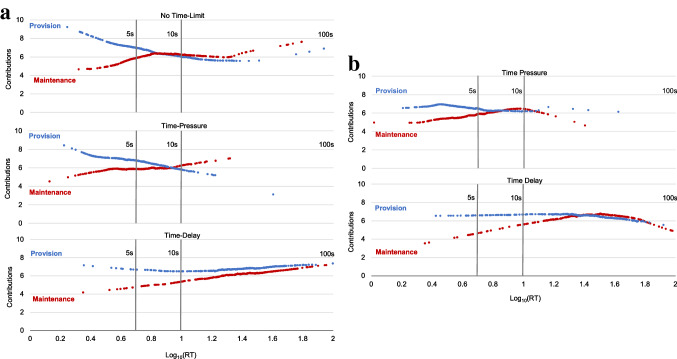
Figure 2.
Cooperation by response times. (a) Study 1: Plotted are cooperation and response times (RT) in NTL, TP and TD. (b) Study 2: Plotted are cooperation and RT in TP and TD. The graphs show LOWESS estimates, representing the relationship between tokens contributed to the public good and RTs, shown for each social dilemma. Each series is composed of OLS estimates in the locality of each RT observation (bandwidth 0.8). Estimates for three responses (0.2%) that took longer than 100 s are not shown. Corresponding linear model estimates are in Tables S1 and S2.

