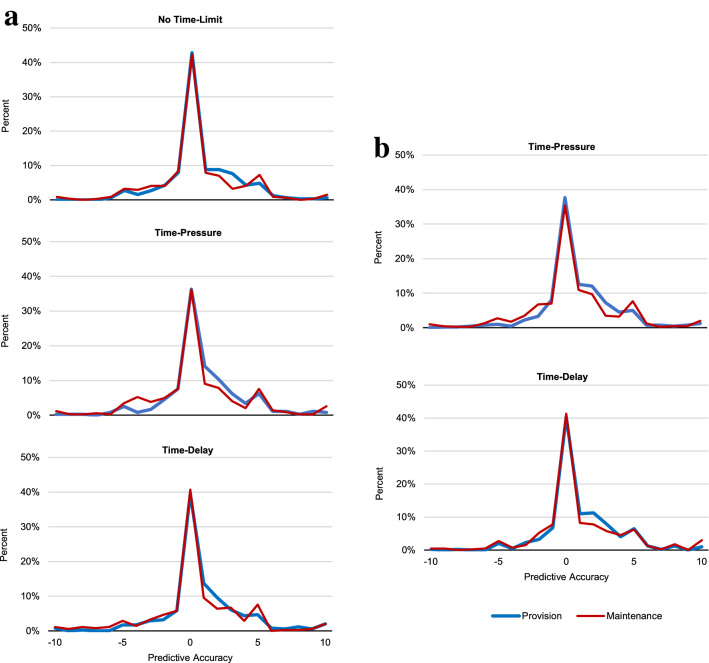
Figure 6.
Accuracy of strong reciprocity measures in predicting cooperation. (a) Study 1: Distribution of predictive accuracy (the difference between actual and predicted contributions for each participant) in NTL, TP and TD. (b) Study 2: Distribution of predictive accuracy in TP and TD. Note that zero indicates highest predictive accuracy possible. Figures S7 and S8 present this analysis separately for those with (Fig. S7) and without (Fig. S8) correct social dilemma understanding, with very similar results.

