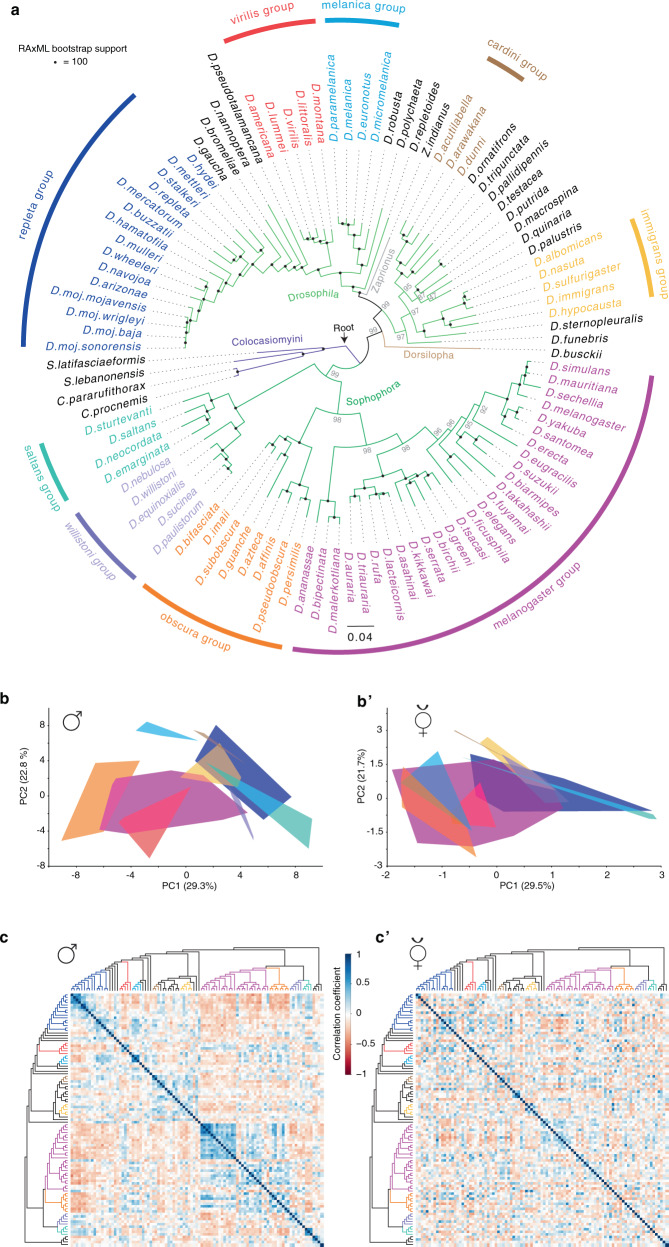
Fig. 1. Phylogenetic relationships and chemical variations among drosophilids.
a Phylogeny of 99 species within the family Drosophilidae inferred from 13,433,544 amino acids sites that represent 11,479 genes (See Supplementary Data 1 and Methods for details). Using four species in the Colocasiomyini subgenus as outgroups (purple), 95 species are distributed in four subgenera belonging to the Drosophilini tribe (Drosophila, light green branches; Zaprionus, gray branch; Dorsilopha, brown branch; Sophophora, dark green branches). Species names are color coded according to their relationships in nine different species groups, with black species depicting individual representatives of species groups. Scale bar for branch length represents the number of substitutions per site. Maximum likelihood (ML) phylogenetic analyses display strong rapid bootstrap support (100% support indicated by black circle at the nodes) for most relationships among the different species. For divergence times, see Supplementary Fig. 1D. b The first two principal components of male chemical profiles (data in Supplementary Fig. 1A) of the 583 replicates across the 99 male species (>5 replicates per species) based on difference in peak areas of 248 male chemical features present across these replicates (see Methods for details). Data points of each group are enclosed within the line. The lines’ fill is colored according to the group identities in Fig. 1a. b’ The first two principal components of female chemical profiles (data in Supplementary Fig. 1A’) of the 528 replicates across the 99 female species (>5 replicates per species) based on the difference in peak areas of 256 female chemical features present across these replicates. c Heat map showing pairwise correlations between male chemical profiles of the 99 species (ordered on each axis according to their phylogenetic relationships from Fig. 1a). Overall peak areas of 248 male chemical features across the 99 species were compared using Pearson correlation coefficient (R2); Color codes in the heat map illustrate the pairwise correlations, which range from dark blue (Perfect correlation between chemical profiles) through white (no correlation) to dark red (perfect anticorrelation). The diagonal of the correlation matrix is the correlations between each species and itself (values of 1). Note that the male correlation matrix displays frequent dark blue cells mainly around the diagonal, i.e., high correlation coefficients are observed mostly between closely related species. c’ Pairwise correlation analysis between female chemical profiles of the 99 species arranged according to their phylogeny from Fig. 1a. Overall peak areas of 256 female chemical features across the 99 species were compared using the Pearson correlation coefficient (R2). See Supplementary Data 2 for the statistical Pagel’s lambda correlation analysis.

