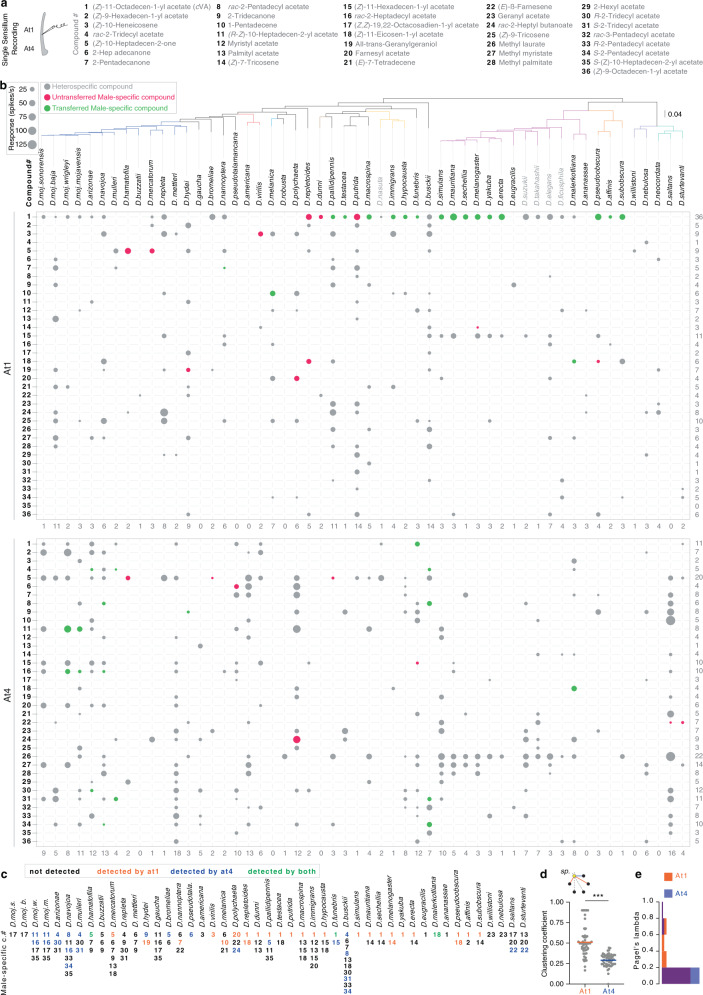
Fig. 3. Drosophilids communicate intra- and inter-specifically through rapidly evolving olfactory channels.
a Left: schematics of single sensillum recordings (SSR) from the antennal trichoid (at1 and at4) sensilla. Right: Names of the different chemicals used to screen the trichoid sensilla. Note that all chemicals are male-specific compounds identified in this study (Fig. 2b), except compounds# 25, 26, 27, 28, 29, 32, and 36, which were described as flies’ pheromones in refs. 51, 53, 54. b Color-coded electrophysiological responses towards heterospecific compounds (grey bubbles) and conspecific compounds (colored bubbles) in at1 (top) and at4 (bottom) sensilla of females of 54 species. Compound names are depicted in Fig. 3a. Red and green bubbles represent species-specific male untransferred and transferred compounds, respectively. Bubble size corresponds to the average of response values (n = 3–10) ranging from 25 to 125 spikes per second. Responses less than or equal to 10 spikes per second were excluded from the bubble chart (see Supplementary Fig. 3A, A’, and “Methods” for more details). Species names are arranged on the top according to their phylogenetic relationship; the tree branches are colored according to the group identities. Numbers on the right side represent the sum of species that can detect each of the male-specific compounds, while the number below the table represents the sum of chemicals that can be detected by each species. Note that the compounds’ vapor pressures have no impact on the number of the olfactory responses (Supplementary Fig. 3D). c A summary of female’s abilities to detect their own male-specific compounds through olfaction in 47 dimorphic species (two species, D. robusta and D. neocordata, whose compounds were not included among the 36 compounds, was excluded). Black numbers, undetected male-specific compounds; orange, detected by at1 neuron(s); blue, detected by at4 neurons; green, detected by both. See Supplementary Fig. 3A for more details about the number of neurons in at1 sensillum. Note that, out of 47, females of 36 species detect their conspecific male cues through at1 and/or at4. d Top: A schematic example of how to calculate the olfactory clustering coefficient of a given species (yellow circle) to communicate with heterospecific species (black circles) through at1 (orange lines) and at4 (blue lines). The olfactory clustering coefficient is the number of other species-specific compounds that are detected by a given species through at1 or at4 (colored lines) divided by the total number of detected and undetected species (colored + grey dashed lines). The clustering coefficient of a species is a number between 0 (i.e., no species detected) and 1 (i.e., all species detected). Below: scatter plot indicates olfactory clustering coefficients of the 54 species and their mean through at1 (orange) and at4 (blue); Two-sided Mann–Whitney U test, ***P < 0.001 (n = 54 species). Note that species exhibit more olfactory intra- and inter-specific communication through at1 than at4. See Supplementary Fig. 3B, B’ and “Methods” for more details on communication network analyses. e Frequency histogram of Pagel’s lambda estimates, which explain the correlation between the olfactory responses of at1 (orange) and at4 (blue) among the different species and their phylogenetic relationships. Note that responses of both at1 and at4 display low phylogenetic signals (i.e., do not correlate with the phylogeny). In addition, their phylogenetic signals are comparable to each other; Two-sided Mann–Whitney U test, ns P = 0.27 between at1 and at4 responses.

