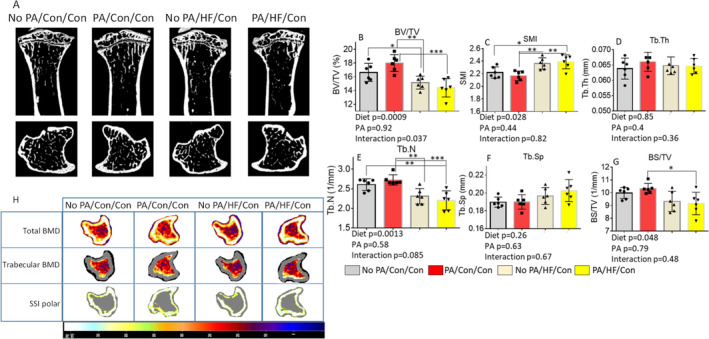
Fig 7.

Short‐term early‐life–increased PA exacerbates HFD‐induced persistent effects on bone loss. (A) Representative μCT images of the proximal tibia from one sample from each group of mice. Upper panel shows sagittal view and lower panel shows transverse view; white lines and dots indicate trabecular or cortical bone tissues. (B–G) μCT measures of six parameters from trabecular tibias from no PA/con/con, PA/con/con, no PA/HF/con, and PA/HF/con of 20‐week‐old mouse groups. All data were expressed as mean ± SD (n = 6 per group), p value was analyzed by two‐way ANOVA with a HFD and early‐life PA as the main factors, and their interactions. Additionally, * p < 0.05 by t test compared with no PA/control group.Data were expressed as mean ± SD (n = 6 per group. p Value was analyzed by two‐way ANOVA with a HFD and early life PA as the main factors and their interactions. Additionally, *p < 0.05, **p < 0.01, ***p < 0.001 by Tukey's multiple comparison. (H) Representative images of transverse views of quantitative pQCT analysis of one slice of the proximal tibia from one sample from each group of mice. Color changes from black to white indicate bone density from low to high. BS/TV, bone surface density; BV/TV, bone volume/total tissue volume; Con, control; HF, high fat; SMI, structure model index; SSI, stress–strain index; Tb.N, trabecular number; Tb.Sp, trabecular separation; Tb.Th, trabecular thickness.
