FIGURE 4.

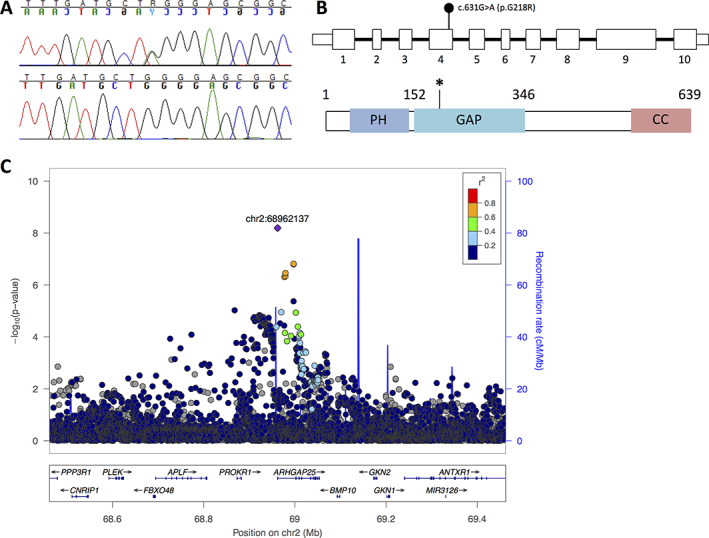
Genetic findings in a family with a heterozygous p.G218R ARHGAP25 mutation. (A) Sequence image of the heterozygous point mutation in the index patient (II‐2) and normal sequence from a healthy family member (I‐1). (B) Schematic presentation of ARHGAP25 and the location of the heterozygous missense mutation c.652G>A (p.G218R) in exon 4. (C) Regional TB‐BMD association plot for the ARHGAP25 locus. Each circle represents one SNP in the locus and its y‐coordinate the significance for the TB‐BMD GWAS meta‐analysis (n = 66,628) reported by Medina‐Gomez et al.( 28 ) Different colors indicate varying degrees of pairwise linkage disequilibrium with the top marker [rs10048745] according to the 1000 Genomes – CEU population. Abbreviations: CEU, Utah residents (Centre d'Etude du Polymorphisme Humain [CEPH]) with Northern and Western European ancestry; GWAS, genomewide association study; TB‐BMD, total body–bone mineral density.
