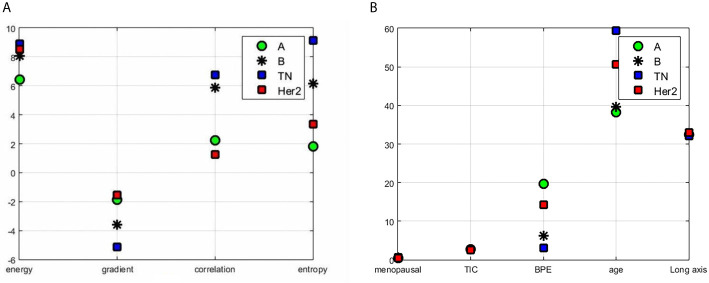
Figure 2.
Results of features contrast of the different subtypes: (A) the representative gradient features including energy, gradient, correlation, and entropy; (B) the contrast results for clinic features which contain menopausal, TIC curve type, BPE classification value, patient age, and tumor length among the four types.

