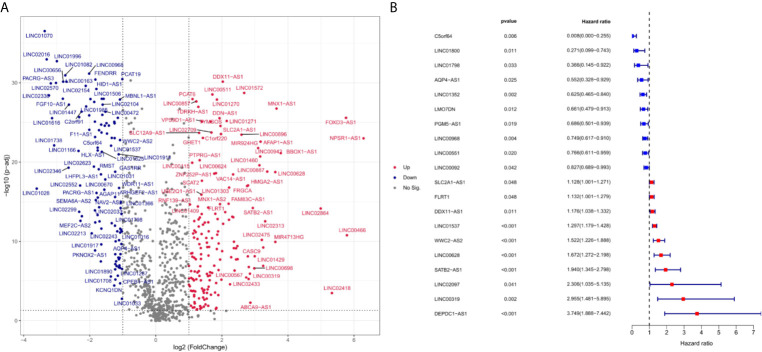
Figure 1.
Differentially expressed ferroptosis-related lncRNA between LUAD and normal samples (log2 fold change>2, adjusted p-value < 0.01). Compared with normal samples, 49 ferroptosis-related lncRNAs were upregulated and 43 ferroptosis-related lncRNA downregulated in LUAD samples. (A) is a volcano map for differentially expressed ferroptosis-related lncRNAs. Red dots represent significantly upregulated expressed genes and green dots represent significantly downregulated expressed genes. (B) indicates the HR (95% Cl) and p-value of selected lncRNAs by univariate Cox proportional hazards. Blue dots represent protective factors, and red dots represent risk factors.

