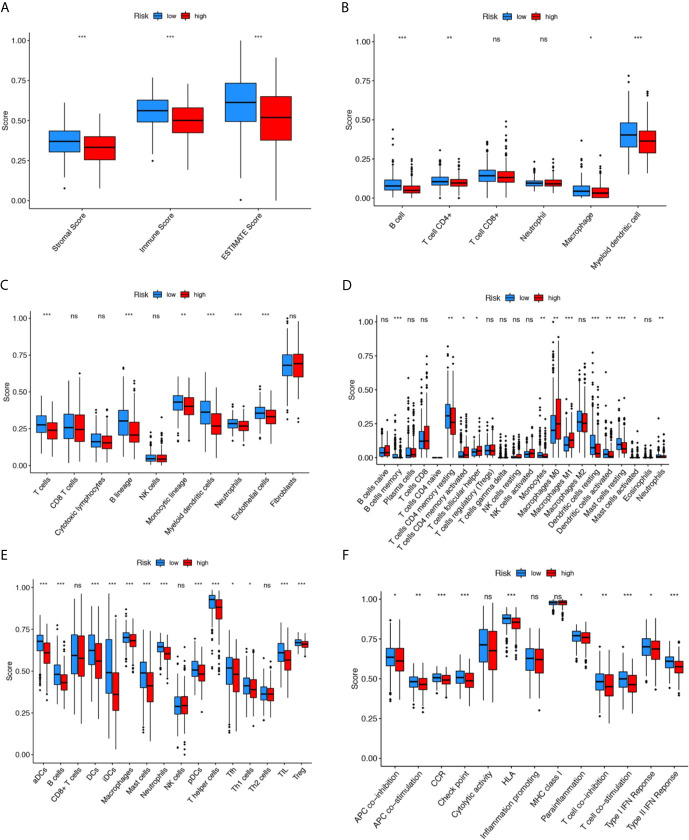
Figure 5.
Comparison of the immunity analysis between different risk groups. (A–F) indicates the ESTIMATE, TIMER, MCP counter, CIBERSORTx, and single-sample gene set enrichment analysis (ssGSEA) algorithms to compare the cellular components or cell immune responses between two groups. CCR, cytokine-cytokine receptor. Adjusted P values were showed as: ns, not significant; *P < 0.05; **P < 0.01; ***P < 0.001.

