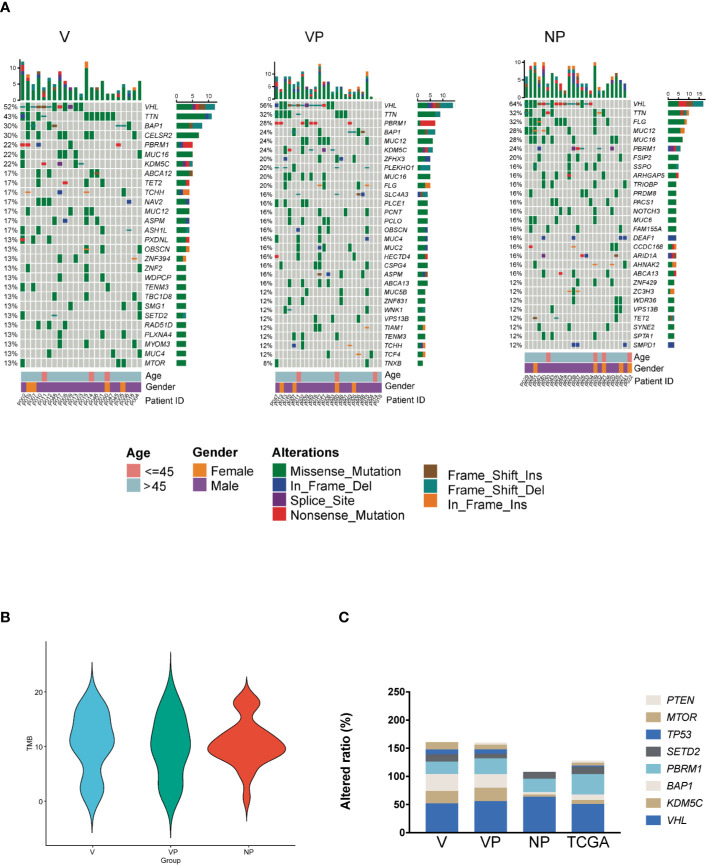
Figure 1.
Somatic mutation landscape of ccRCC with and without VTT. (A) Mutation landscape of the NP (n = 25), VP (n = 25), and V (n = 23) samples. The vertical histogram shows the number of different mutational types in each sample. The heat map shows the distribution of top genes across samples. The horizontal histogram shows the number of different mutational types in each gene. (B) The tumor mutation burden of the V, VP, and NP groups. (C) The frequency of mutations in driver genes of ccRCC in the three groups (V, VP, and NP) and in data obtained from TCGA. TCGA, The Cancer Genome Atlas; VTT, venous tumor thrombus; ccRCC, clear cell renal cell carcinoma; V, VTT; VP, matched primary tumor; NP, normal primary tumors without VTT.

