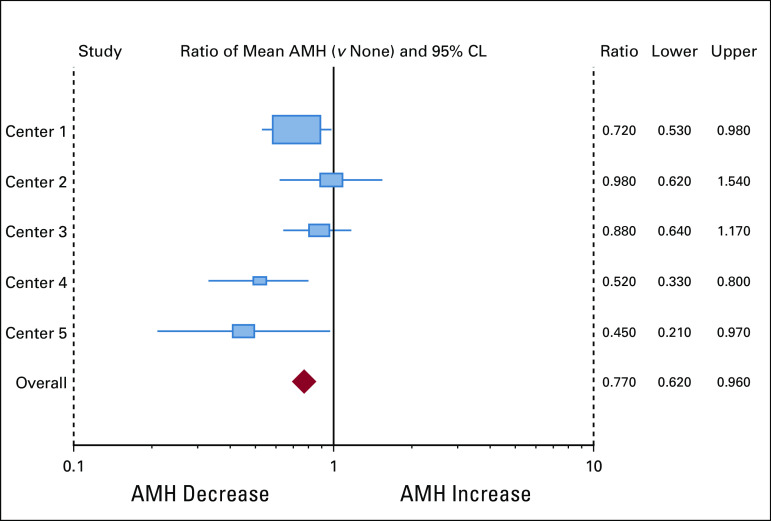
FIG 2.
AMH values by BRCA. Forest plot analysis of individual results from five participating centers. One is null value of 0 difference or decrease. Individual centers were minimally adjusted, whereas overall data were adjusted for center, age, smoking, OCP, and BMI. AMH, anti-Müllerian hormone; BMI, body mass index; OCP, oral contraceptive pills.

