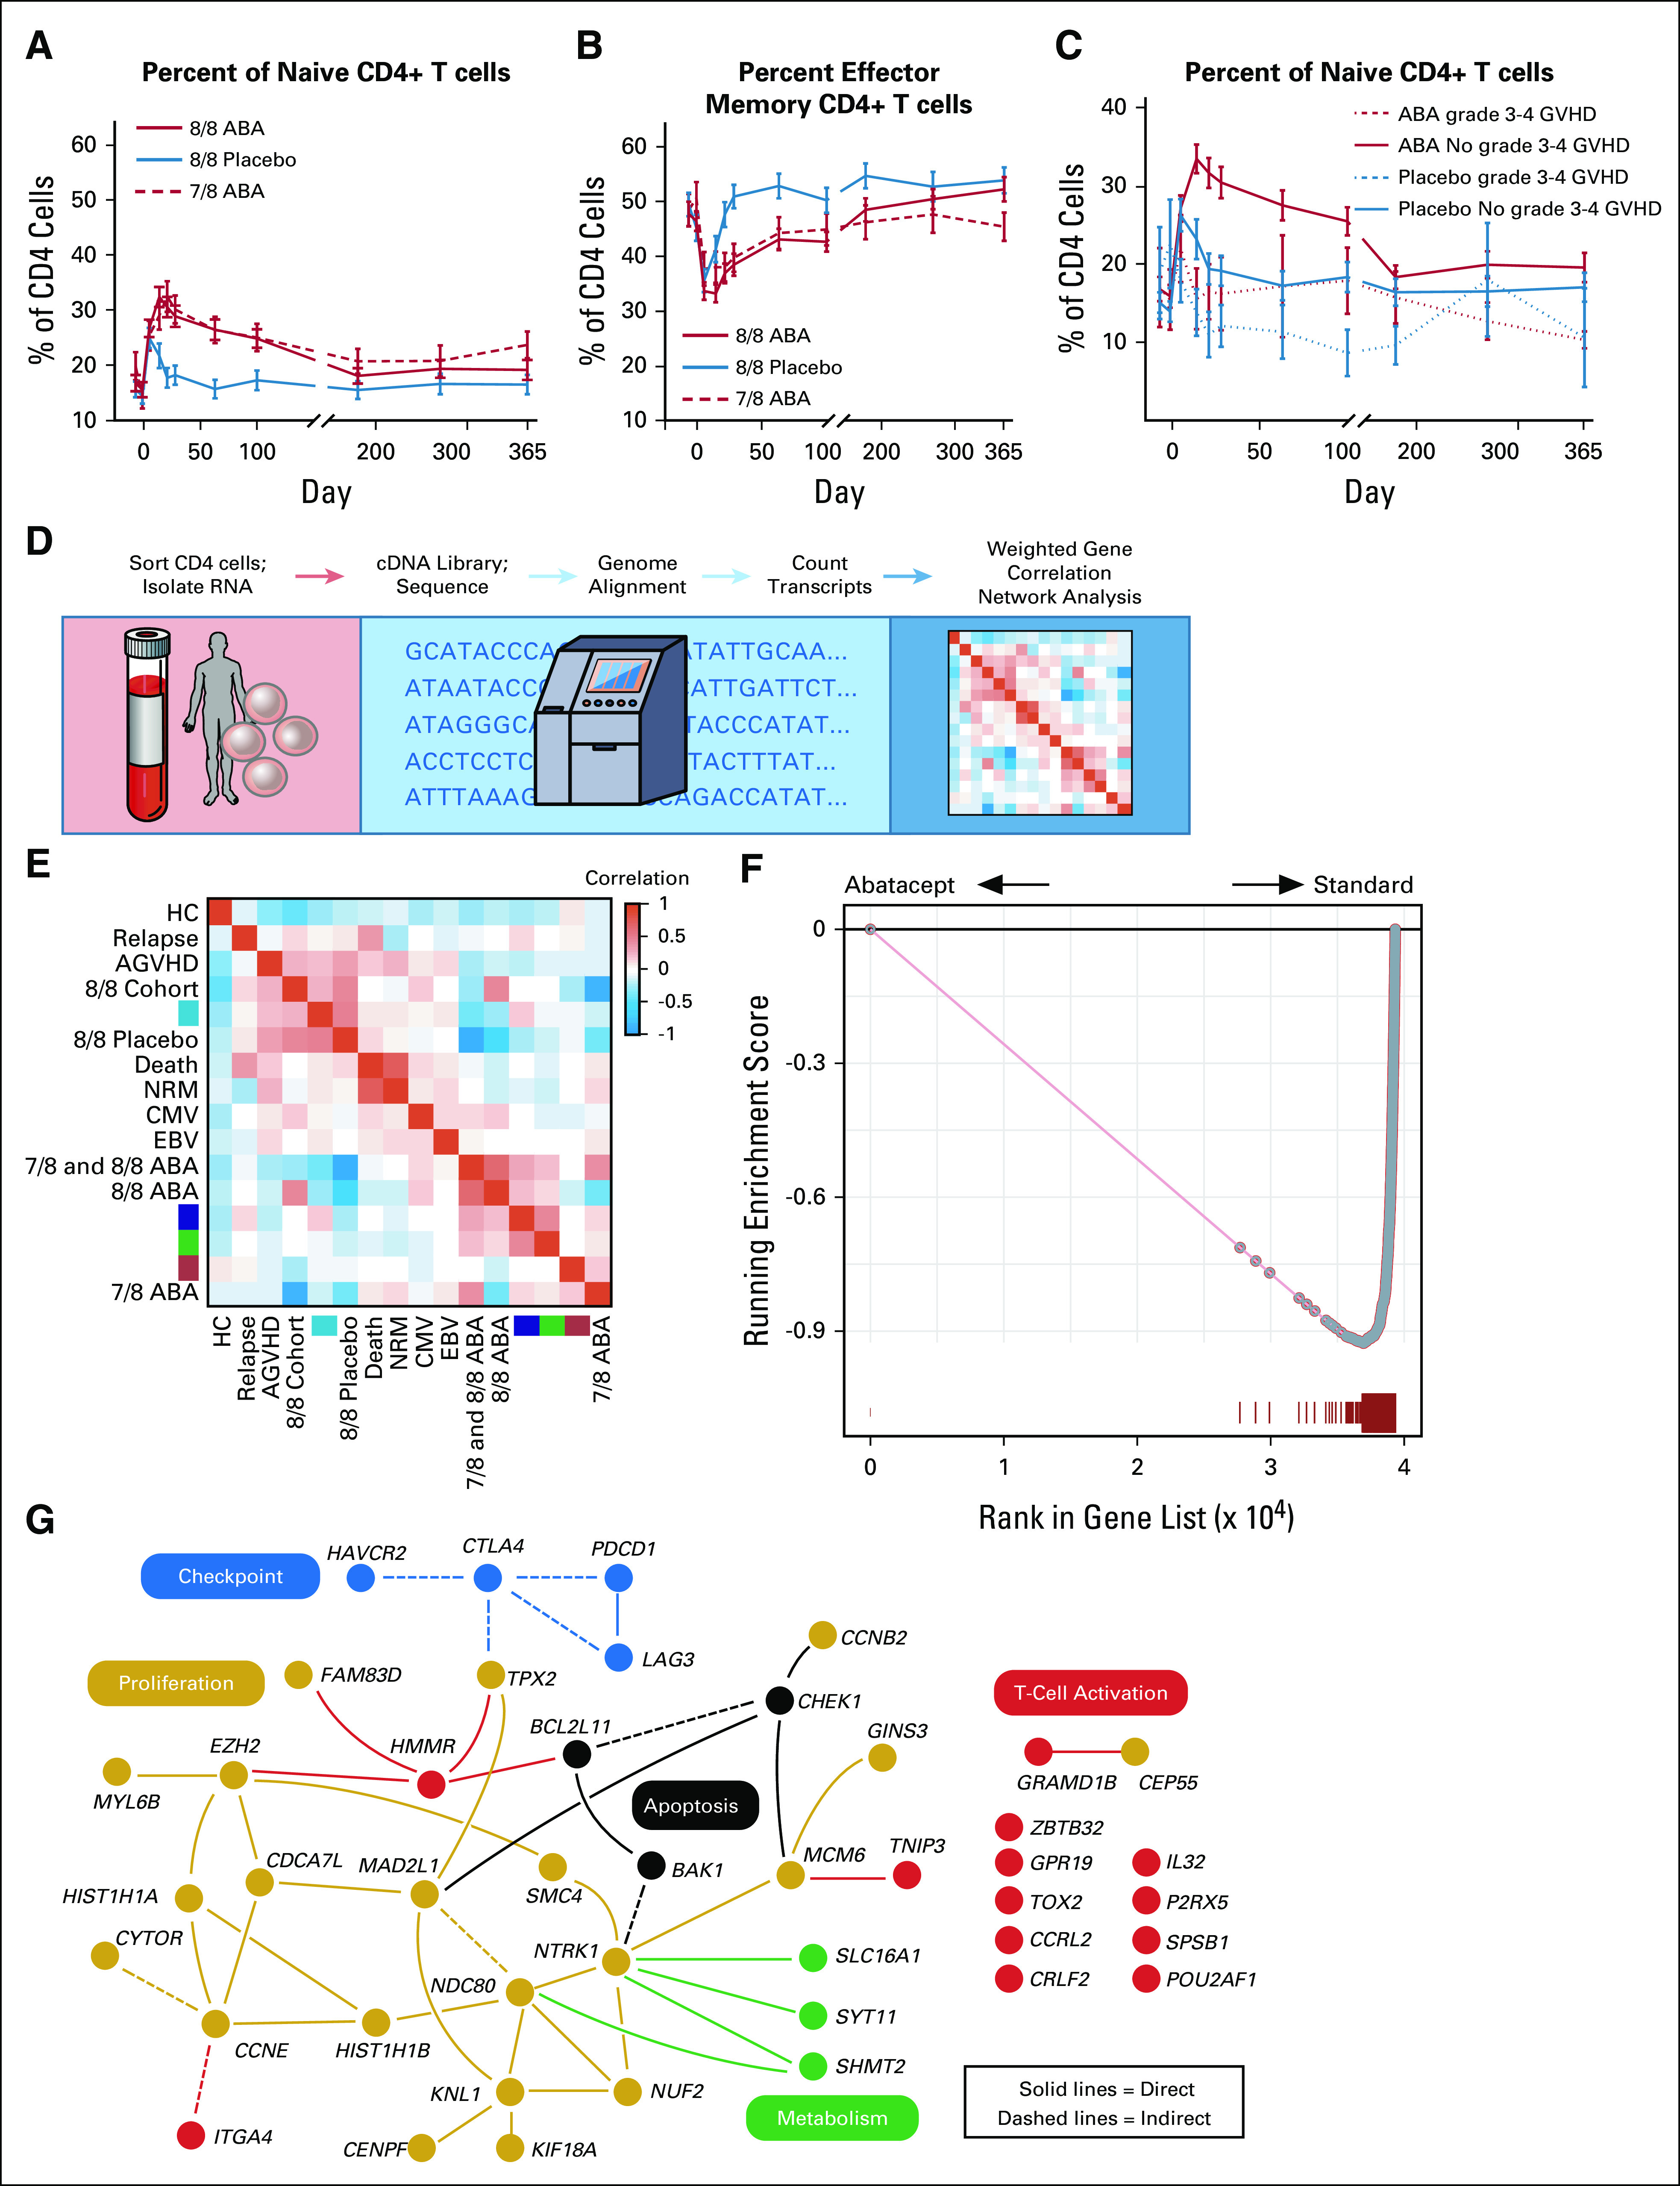
FIG 4.

Post-transplant immunologic analysis. (A) Percent of CD4+ naive T cells (compared with total CD4+ T cells). ANOVA P value = .00004; 8/8 ABA versus 7/8 ABA P = .99; 8/8 ABA versus 8/8 placebo P = .0001; 7/8 ABA versus 8/8 placebo P = .0016. (B) Percent of CD4+ effector-memory T cells (compared with total CD4+ T cells). ANOVA P value = .0052; 8/8 ABA versus 7/8 ABA P = .52; 8/8 ABA versus 8/8 Placebo P = .0034; 7/8 ABA versus 8/8 placebo P = .18. (C) Percent of CD4+ naive T cells (compared with total CD4+ T cells), dichotomized by grade 3-4 AGVHD. ABA patients with no grade 3-4 GVHD versus ABA patients with grade 3-4 GVHD P = .024. In A-C, data are shown as the percentage ± SEM. In A-B, dashed red = 7/8 ABA intent-to treat; solid red = 8/8 ABA; solid blue = 8/8 placebo; in C, dashed red = 8/8 ABA with grade 3-4 AGVHD; solid red = 8/8 ABA without grade 3-4 AGVHD; dashed blue: 8/8 placebo with grade 3-4 AGVHD; solid blue = 8/8 placebo without grade 3-4 AGVHD. (D) Transcriptomic analysis pipeline. (E) Weighted gene coexpression network analysis heatmap. Heatmap demonstrates the correlation (using a blue-red false color scale) of weighted gene coexpression network analysis gene modules (colored turquoise, blue, green, and red) in transcriptomic samples grouped by clinical metadata. Row or column order is determined by hierarchical clustering of the module eigengene with clinical metadata for each sample. (F) Gene set enrichment analysis of the turquoise WGCNA module in a ranked list of differentially expressed genes between patients receiving abatacept (left) and patients receiving standard prophylaxis (right). The gene list was generated with a cutoff of FDR < 0.001 by gene-set permutation testing. (G) Ingenuity pathway analysis of the 93-gene subset of the turquoise module. Yellow: proliferation genes; black: apoptosis genes; blue: checkpoint genes; green: metabolism genes; red: T-cell activation genes. Solid lines: direct interactions; dashed lines: indirect interactions. ABA, abatacept; AGVHD, acute graft-versus-host disease; CMV, Cytomegalovirus; EBV, Epstein-Barr virus; FDR, False Discovery Rate; HC, hematopoietic cell; NRM, nonrelapse mortality.
