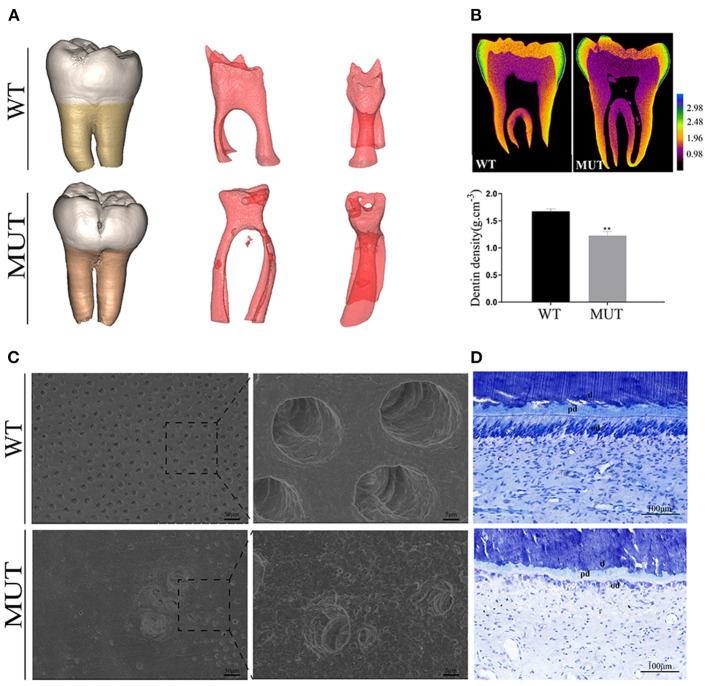
Figure 2.
Teeth ultrastructural analyses. (A) 3D reconstruction of the teeth CT data. 3D reconstruction of the pulp chambers. (B) Typical CT sections of the teeth are presented using false colors calibrated based on the mineral density to generate mineral density maps. (C) SEM of representative exfoliated teeth. The SEM images of the control dentine showed regularly organized dentine tubes and an evenly calcified matrix, while the teeth of the patients with DGI-I presented very few dentine tubules and enlarged malformed dentine tubes. (D) Toluidine blue staining of teeth. The number and morphology of odontoblasts adjacent to the mineralized dentine layer were visibly different. d, dentine; od, odontoblast; pd, predentine.

