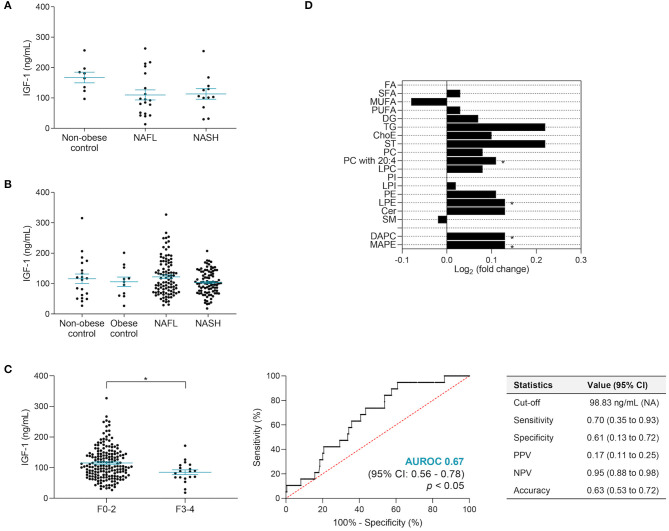
Figure 4.
IGF-1 serum levels correlated with liver fibrosis score. (A) In the discovery cohort, the IGF-1 serum levels were slightly lower in NASH patients compared to NAFL and non-obese contros. (B) No significant differences in IGF-1 levels were found among controls and patients with NAFLD in the validation cohort. (C) In the validation cohort, NAFLD patients with advanced fibrosis presented significantly lower levels of IGF-1. The x-axis represents fibrosis score dichotomy: none to moderate fibrosis (F0-2; n = 184) and advanced fibrosis to cirrhosis (F3-4; n = 19). IGF-1 alone presents an AUROC value of 0.67 when distinguishing F0-2 vs. F3-4. (D) Serum lipidomic signature associated with higher IGF-1 circulating levels. Data presented as log2 of the fold change between higher vs. lower than the median IGF-1 level (103.65 ng/ml). Higher, n = 97; lower, n = 97. IGF-1 levels depicted as mean ± SEM. Cer, ceramide; ChoE, cholesteryl ester; CI, confidence interval; DAPC, diacylglycerophosphocholine; DG, diglyceride; FA, fatty acid; IGF-1, insulin-like growth factor 1; LPC, lysophosphatidylcholines; LPE, lysophosphatidylethanolamines; LPI, lysophosphatidylinositols; MAPE, monoacylglycerophosphoethanolamine; MUFA, monounsaturated FA; NAFL, non-alcoholic fatty liver; NASH, non-alcoholic steatohepatitis; NPV, negative predictive value; PPV, positive predictive value; PC, phosphatidylcholines; PE, phosphatidylethanolamines; PI, phosphatidylinositols; PUFA, polyunsaturated FA; SFA, saturated FA; SM, sphingomyelins; ST, steroids; TG, triglycerides; 20:4, arachidonic acid. *p < 0.05.

