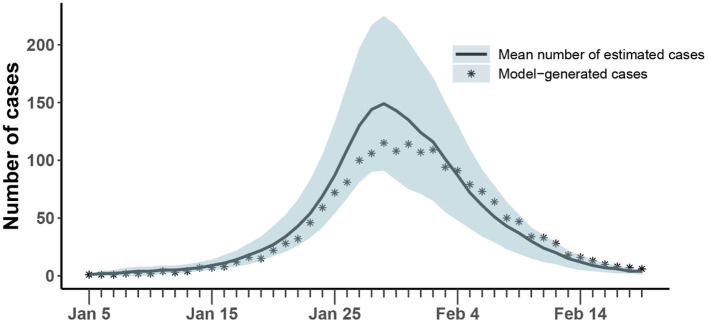
Figure 4.
Comparison of the number of cases estimated and generated. The asterisk represents the number of cases with symptoms observed on a daily basis; the curve shows the change in the average number of confirmed symptomatic cases per day estimated by the model. The light blue shade was the 95% confidence interval of the estimation.

