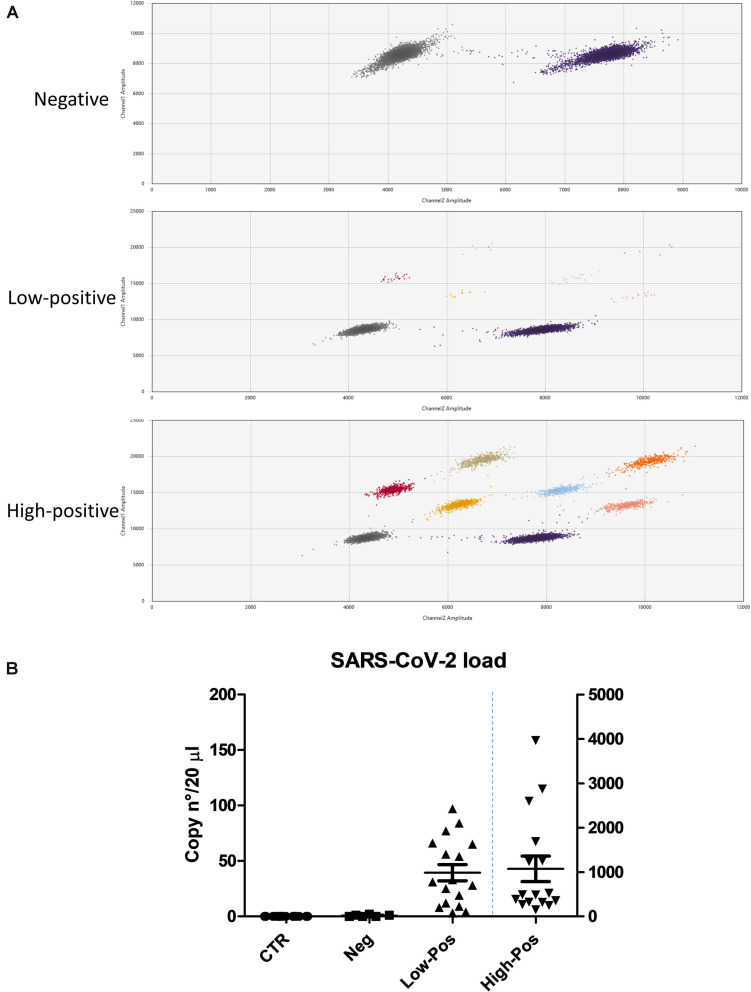
FIGURE 1.
SARS-CoV-2 load in control and COVID-19 subjects, as measured by ddPCR. (A) Graphical representation of the values detected by the use of three different molecular probes: negative samples, only the clouds corresponding to the housekeeping control genes are detectable (gray and purple clouds); low- and high-positive samples, the clouds corresponding to the virus genes are detectable and counted (positives to individual FAM probes: gray, red, and yellow; positives to individual HEX probes: purple, blue, and pink; double positives to FAM/HEX probes: beige and orange). (B) Virus load, expressed as genome copy number per analyzed sample (20 μl of extracted nucleic acid); left y axis refers to control, negative and low-positive values, whereas right y axis refers to high-positive COVID-19 subjects. Mean value ± SEM is also reported.

