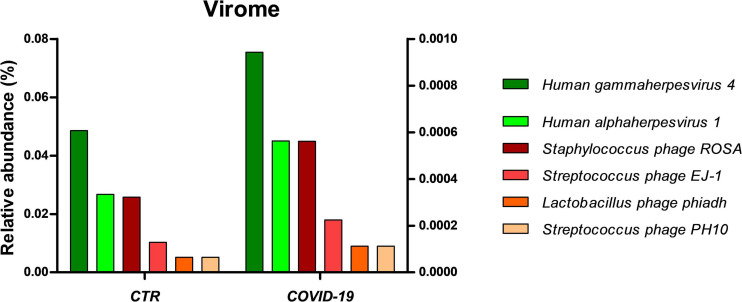
FIGURE 6.
Virome profile in the oral cavity of control (CTR) and COVID-19 subjects. The results are expressed as relative abundance (%). Left y axis refers to Human gammaherpesvirus 4 and Human alphaherpesvirus 1 (green bars), whereas right y axis refers to the amount of the four detected bacteriophage (orange-red bars).

