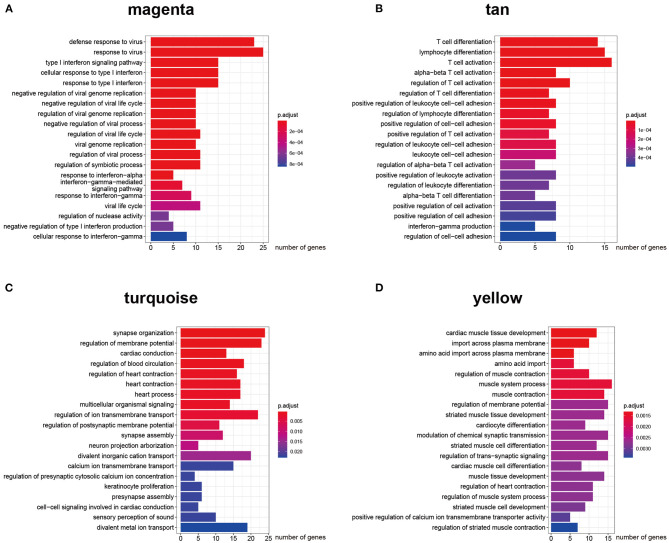
Figure 4.
Gene ontology biological process enrichment analysis for each ceRNA network. (A–D) Top 20 enriched gene ontology biological process terms of protein-coding genes in AF susceptibility-associated magenta (A) and tan (B) ceRNA networks, and AF persistence-associated turquoise (C) and yellow (D) ceRNA networks.

