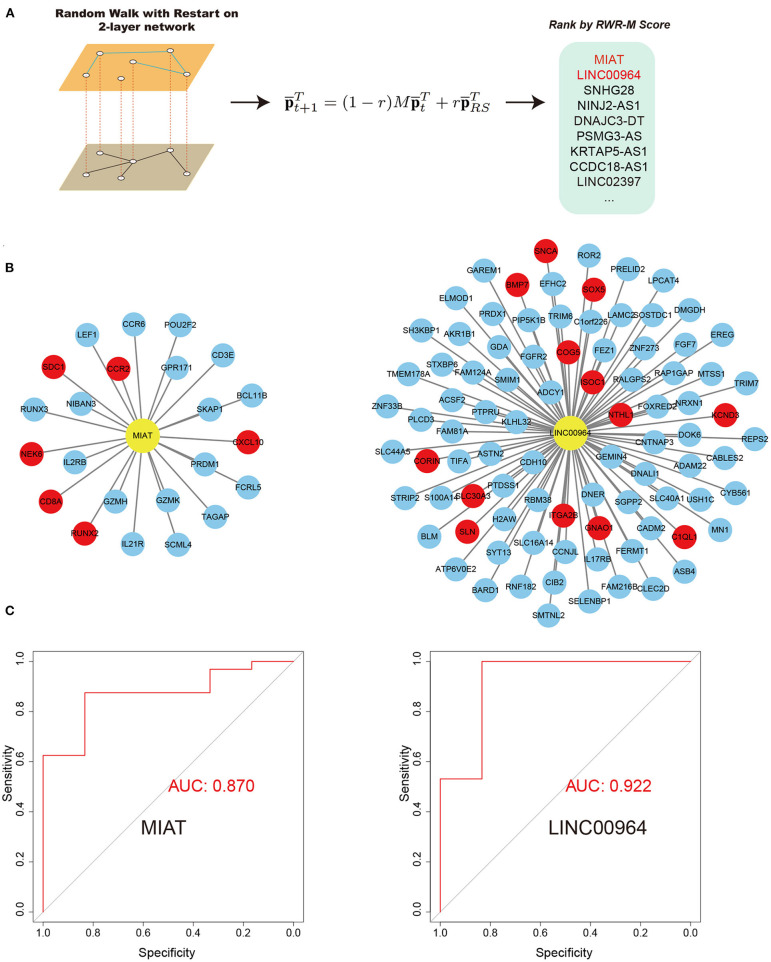
Figure 5.
RWR-M algorithm and the performance of random forest classifiers in the test set. (A) Process of RWR-M. (B) MIAT-related ceRNA pairs (left) and LINC00964-related ceRNA pairs (right). Yellow color represents lncRNAs and red color represents known AF protein-coding genes. (C) Performance of the MIAT-related ceRNA pairs-based classifier (left) and the LINC00964-related ceRNA pairs-based classifier (right), as reflected by their respective receiver operating characteristic curves.

