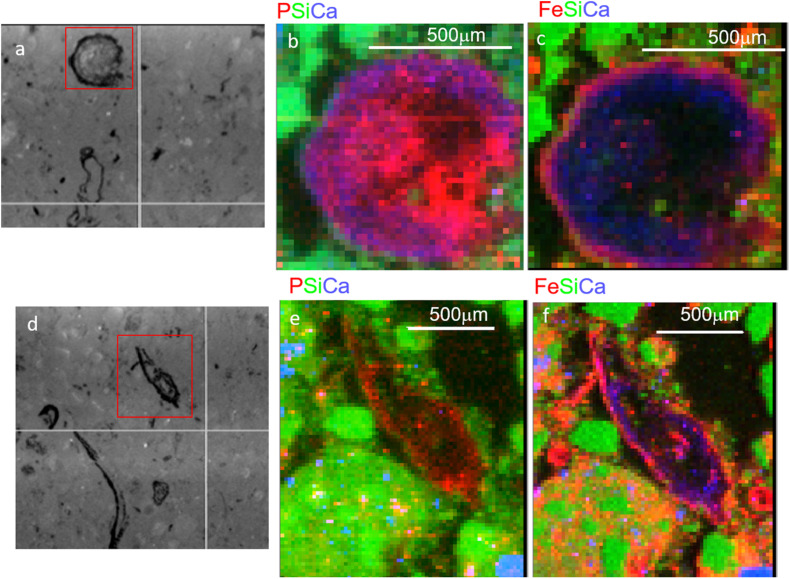
FIGURE 2.
Micro x-ray fluorescence (μ-XRF) maps of soil from Terrace 3 at 15–21 cm depth. Two regions with organic-rich detritus are shown, with microscope images in panels (a,d), and tri-color elemental maps (area indicated by red box) for P, Si, and Ca (b,e) and Fe, Si, and Ca (c,f). Note the smaller red dots scattered throughout (e) are artifacts from the high Si concentrations and do not represent actual P.

