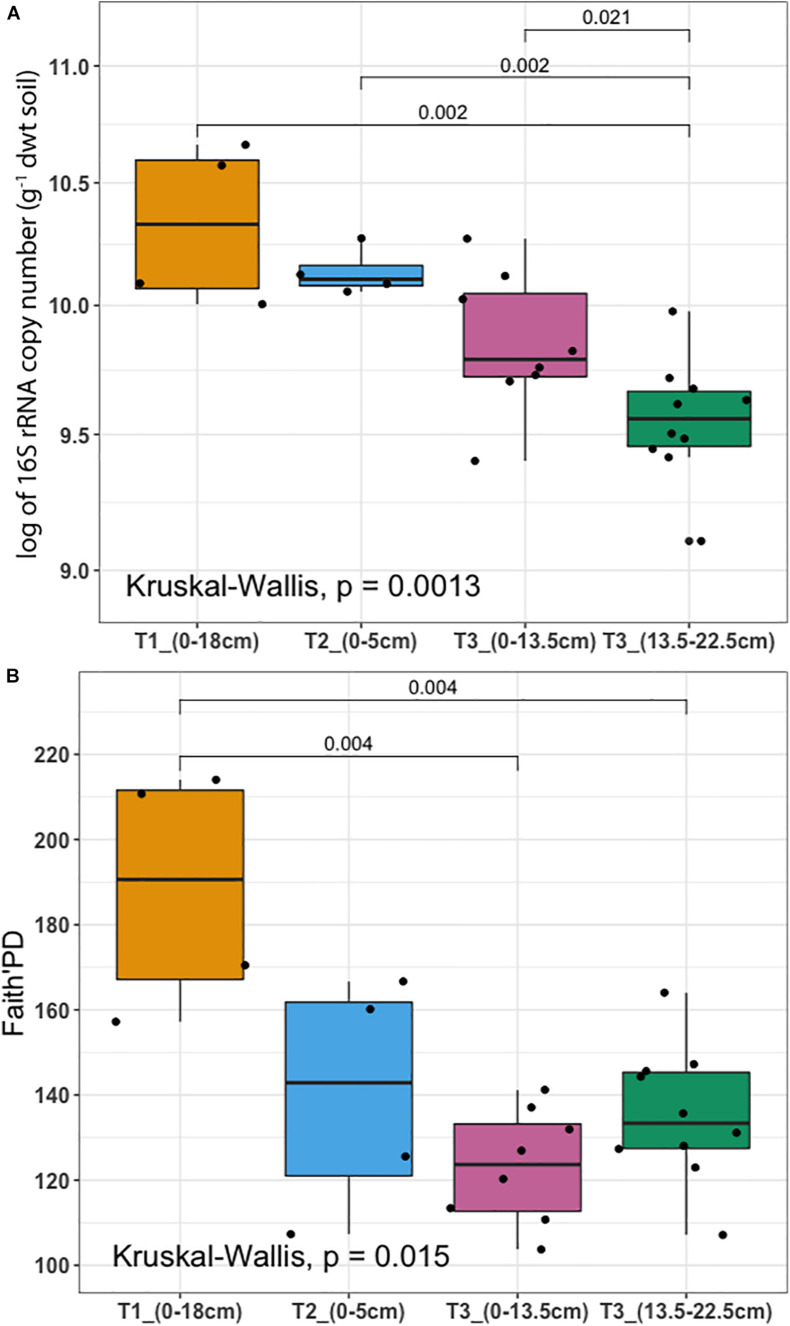
FIGURE 3.
Microbial biomass and diversity analysis (A) 16S rRNA gene copy number per gram of dry weight soil assessed by qPCR (y-axis was logarithmically transformed). (B) Faith’s Phylogenetic Diversity (Faith’s PD). Samples were collected from three terraces with different depths: T1_(0–18 cm) (yellow), T2_(0–5 cm) (blue), T3_(0–13.5 cm) (pink), and T3_(13.5–22.5 cm) (dark green). In each box plot, a point denotes a single soil sample. The top and bottom of each box represent the 25th and 75th percentiles, the horizontal line inside each box represents the median and the whiskers represent the range of the points excluding outliers. Differences between terraces were evaluated using the Kruskal-Wallis analysis of variance, followed by post hoc Mann-Whitney-Wilcoxon test pairwise differences.

