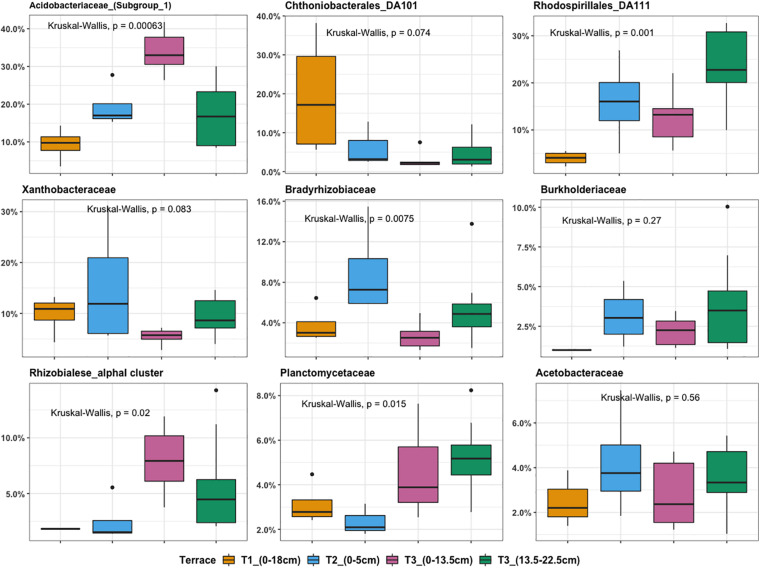
FIGURE 4.
Boxplot illustrating the most abundant bacterial families ranked by relative OTU distribution across terraces. The top and bottom of each box represent the 25th and 75th percentiles, the horizontal line inside each box represents the median and the whiskers represent the range of the points excluding outliers. Outliers are denoted as large points outside whiskers. Significant contributions of terrace locations and depths to observed differences in OTU relative abundance were tested using Kruskal-Wallis test.

