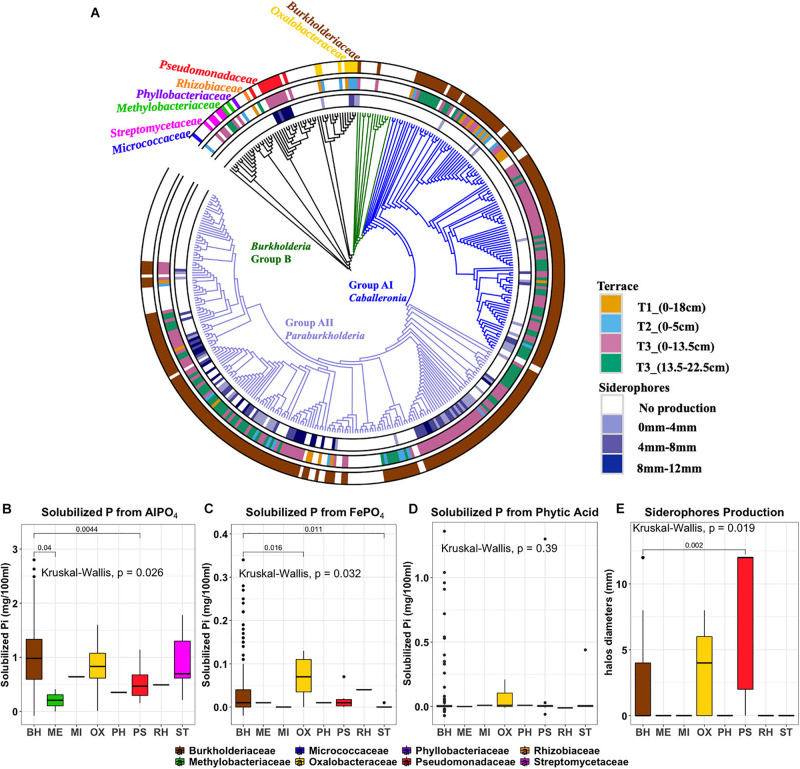
FIGURE 5.
(A) Phylogenetic tree of 270 ES isolates and representative sequences as references. Rings, from the outer to the inner circles, represent: Ring1, taxonomy at family level. Ring2, Terrace of origin. Ring3: Siderophore production, with color gradient representing the diameter of colored halo production. (B) aluminum phosphate solubilization (C) iron phosphate solubilization (D) phytic acid solubilization (E) siderophore production. Outliers are denoted as large points outside whiskers. The Kruskal-Wallis test was used to compare the differences of P solubilization between isolates from different bacterial families. The Mann-Whitney-Wilcoxon was used to conduct pairwise post hoc comparisons.

