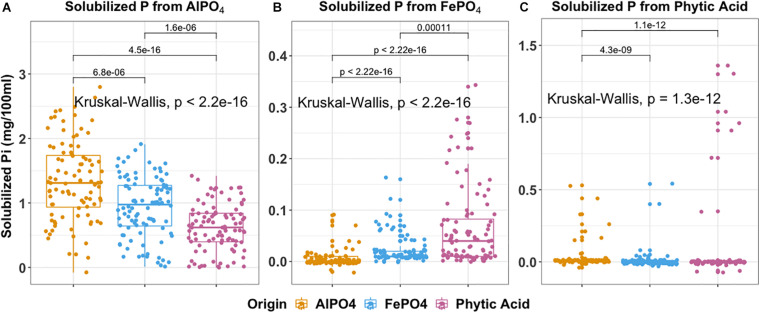
FIGURE 6.
Boxplot indicates P solubilization ability of 288 isolates grouped by the isolation medium of origin. (A) aluminum phosphate solubilization (B) iron phosphate solubilization (C) phytic acid solubilization. In each box plot, a point denotes a single ES isolate. The top and bottom of each box represent the 25th and 75th percentiles, the horizontal line inside each box represents the median and the whiskers represent the range of the points excluding outliers. Kruskal-Wallis was used to compare the differences in P solubilization between bacteria obtained using different isolation media. The Mann-Whitney-Wilcoxon was used to conduct pairwise post hoc comparisons.

