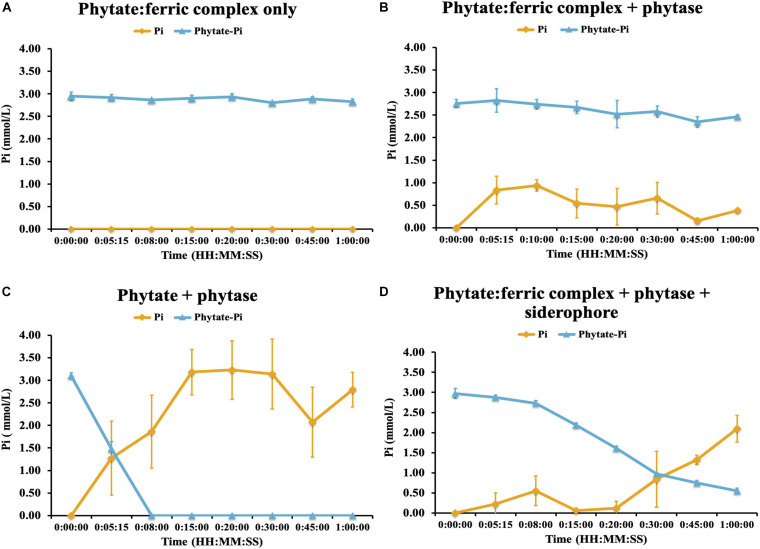
FIGURE 7.
Phytase hydrolysis kinetics on ferric-complexed phytate: (A) ferric-phytate complex only (B) ferric-phytate complex incubated with phytase (C) phytate incubated with phytase (D) ferric-phytate complex incubated with phytase and a siderophore (ferrichrome). Concentration of free PO4 (yellow line) and PO4 of phytate (blue line) were measured by ion chromatography over 1 h. Each treatment had three replicates. Standard deviations are indicated by the error bars.

