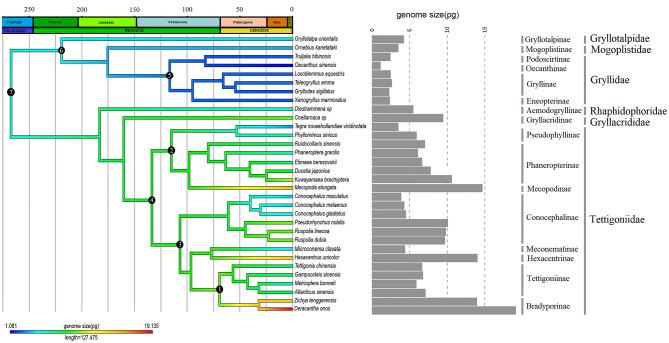
Figure 3.
Ancestral reconstruction of the genome size of (female) Ensifera based on a time-calibrated phylogenetic tree. The black circles with numbers on the nodes correspond to the estimated ancestral genome size using fastAnc, BayesTrait, and Mesquite in Table 2. The average genome size of each species is shown in a histogram on the right.

