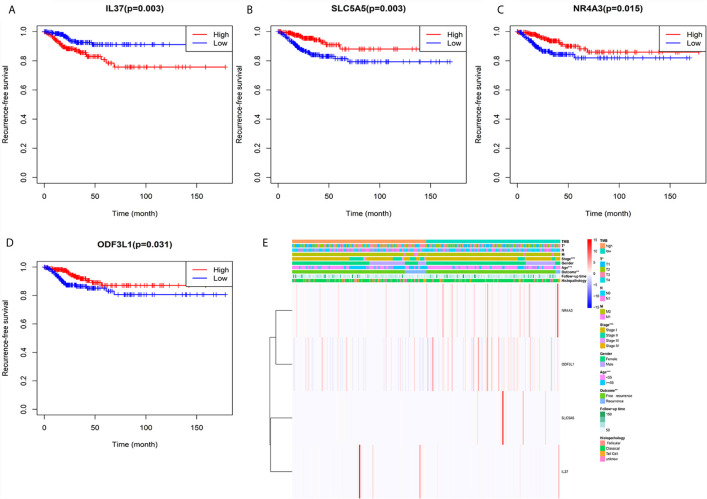
Figure 5.
Heatmap of the relationship between TMB related genes and clinical features. (A) Kaplan–Meier survival analysis of IL37. (B) Kaplan–Meier survival analysis of SLC5A5. (C) Kaplan–Meier survival analysis of NR4A3. (D) Kaplan–Meier survival analysis of ODF3L1. (E) The expression levels of the four genes and distribution of clinical features between the high and low TMB groups.

