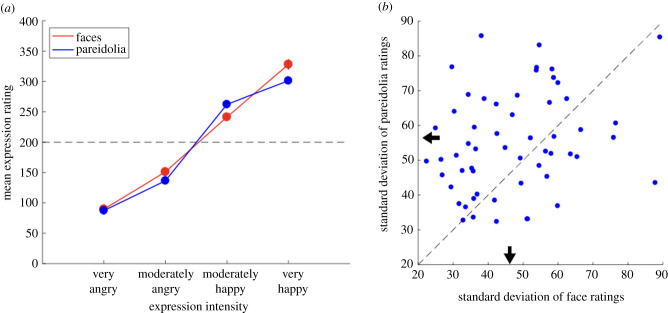
Figure 2.
(a) Mean expression ratings averaged over the 15 participants of Experiment 1. Expression ratings were very consistent between observers and clustered into four levels, validating the four discrete expression levels of the face stimuli. Data points show group means with ±1 s.e.m. (b) Scatter plots of within-subject variability of expression ratings. Each data point shows the standard deviation of one participant's ratings of all images at a given expression level. Most points lie above the unity line, indicating more variable ratings for pareidolia images. Arrows indicate the mean standard deviation of ratings on each axis. (Online version in colour.)

