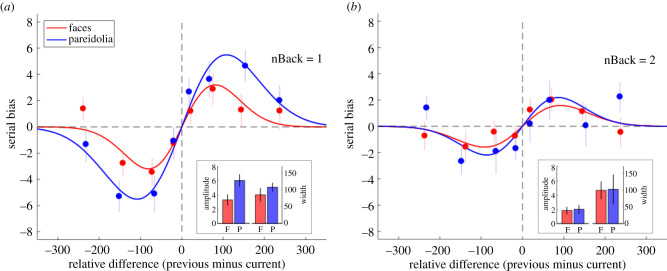
Figure 3.
(a) Expression ratings from Experiment 1 analysed for serial dependence between the current and the previous (i.e. one-back) trial. The data show a positive serial dependence between the current and previous trial for both face and pareidolia images. Data points show the group mean serial effect (n = 15) for face (red) and pareidolia (blue) images with error bars showing ±1 s.e.m. Continuous lines show the best-fitting DoG model (see equation (2.1)). The inset graphs plot the two parameters of the DoG model. Each column shows the mean parameter value produced from 10 000 iterations of bootstrapping, together with ±1 s.d. error bars. (b) Data from Experiment 1 analysed for serial dependence between the current and the two-back trial. Expression ratings show a smaller but still significant positive dependence on the two-back trial rating. (Online version in colour.)

