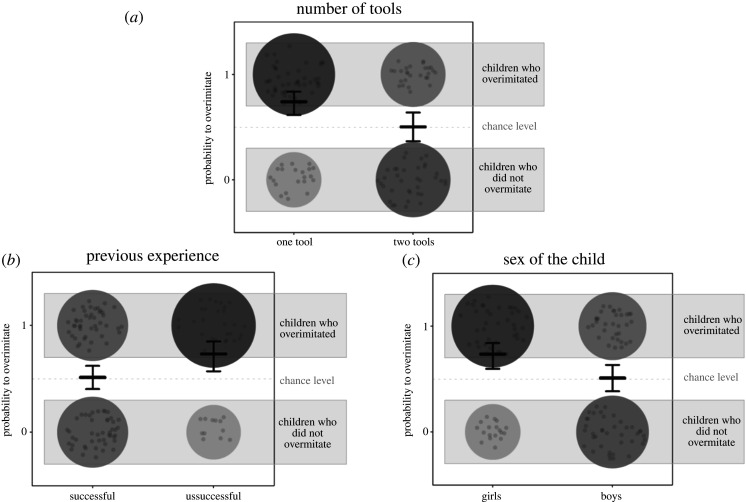
Figure 1.
Probability of children showing overimitation as a function of number of tools (a), previous experience (b) and sex of the child (c). The number of children who overimitated (1) or who did not overimitate (0) is represented by the size and darkness of the large circles (bigger size and darkness represent larger number of overimitators) as well as by the number of small circles (each small circle represents one child). Lines represent the point estimates for the main effects of the GLM (centred for the factors not depicted) with the corresponding 95% confidence intervals that were calculated with parametric bootstraps for all trial analyses and with the function confint of the package stats for the first trial analysis.

