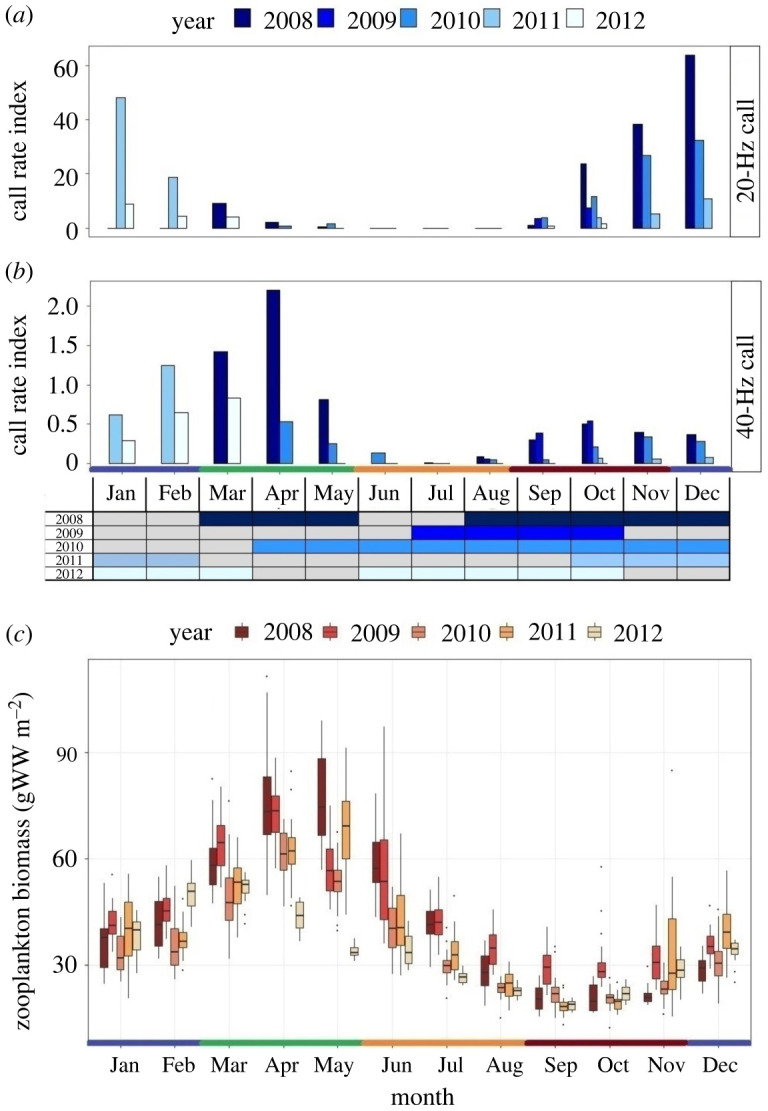
Figure 2.

Monthly variation in (a) 20-Hz and (b) 40-Hz call rates, and (c) model-based estimates of zooplankton biomass (gWW: grams wet weight), from 2008 to 2012. The graph on the x-axis in (a) and (b) represents the recording effort by month and year and grey colour indicates no data. Horizontal lines within the boxplots in (c) indicate the median, box boundaries indicate the 25th (lower boundary) and 75th (upper boundary) percentiles, vertical lines indicate the largest (upper whisker) and smallest (lower whisker) values no further than 1.5 times the interquartile range, and black dots represent outliers. Colours on the x-axis indicate seasons: blue, winter; green, spring; orange, summer; brown, autumn. Abbreviations for months are the following: Jan, January; Feb, February; Mar, March; Apr, April; Jun, June; Jul, July; Aug, August; Sep, September; Oct, October; Nov, November; Dec, December. (Online version in colour.)
