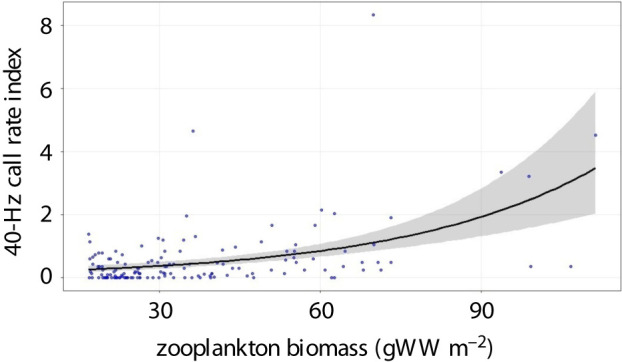
Figure 4.

Zooplankton biomass effect on the 40-Hz call. Blue points represent the observed 40-Hz call rate index. The solid line corresponds to the mean fitted values (i.e. the trend) and the grey shaded area represents the 95% confidence interval. (Online version in colour.)
