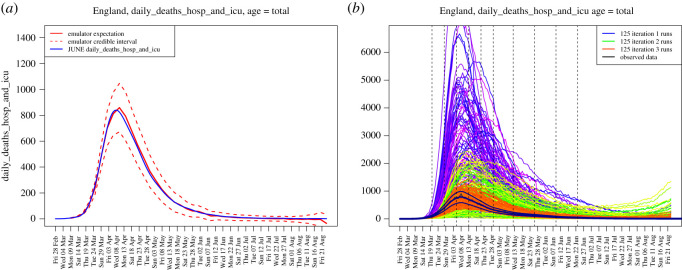
Figure 28.
(a) An example diagnostic showing the emulator prediction ED(fi(x)) for fi(x) across several time points (the solid red line) and the prediction interval (the red dashed lines) along with the held out smoothed run output f(x) (the blue line). The emulator captures the behaviour of the June model well. (b) Daily hospital deaths for all of England, showing the progression of the runs from iterations 1, 2 and 3 used in the history matching process (in purple, green and red respectively). Observed data (smoothed and original) in black. Vertical dashed lines: emulated outputs.

