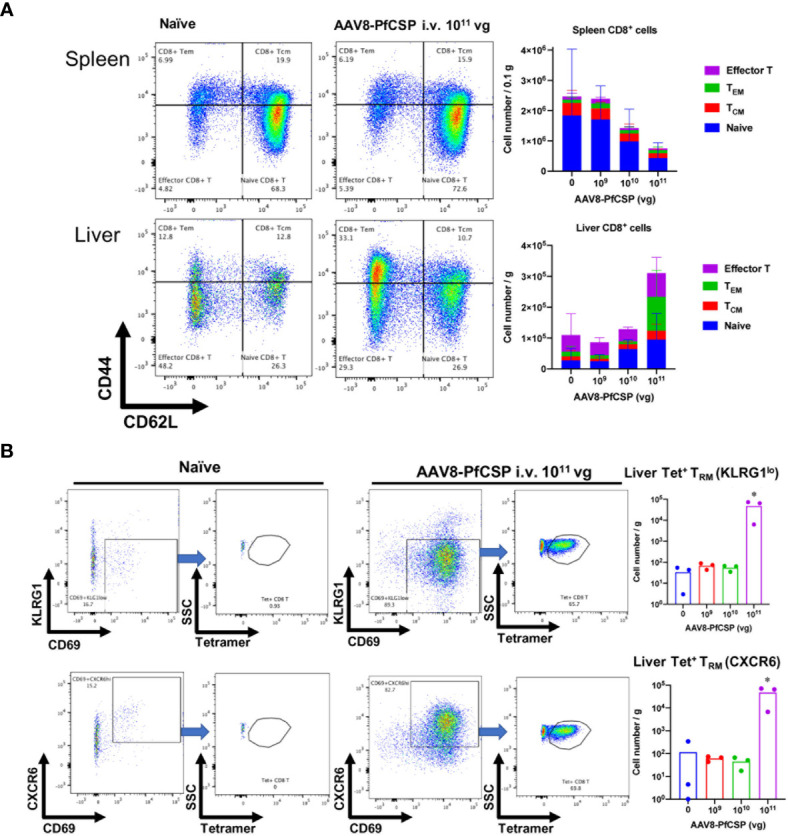
Figure 7.

T-cell responses in the liver and spleen after i.v. immunization with AAV8. Mice were immunized with AAV8-PfCSP (n = 3 per group; 1.0 × 10⁹, 1.0 × 10¹⁰, or 1.0 × 10¹¹ vg) or PBS via i.v. administration into their tail veins. After 2 weeks, the CD8+ T cells collected from the livers and spleens were stained as described in the Materials and Methods. Gated CD45+CD8+T-cells in livers (A, lower panels) or spleens (A, upper panels) were analyzed for CD62L and CD44 expression. The mean absolute numbers of the spleen or liver CD8+T cells are shown in the right-hand graphs. (B) Flow cytometric measurement of CD69 + and KLRG1lo (B, upper panels) or CXCR6+ (B, lower panels) tetramer-stained, CSP-specific liver TRM cells in the CD45+CD8+CD62LloCD44hi TEM population. Mean absolute numbers of the spleen or liver PfCSP-specific CD8+TRM cells are shown in the right-hand graphs. *p < 0.05 by one-way nonparametric ANOVA (Kruskal–Wallis) followed by the Dunn multiple comparisons test.
