Fig. 1.

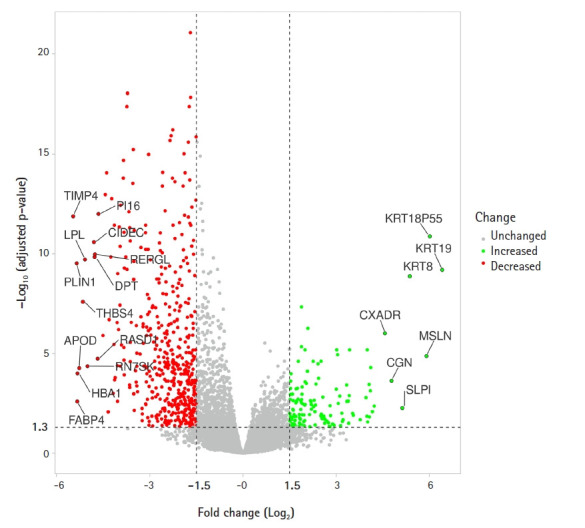
Volcano plot presentation of differentially expressed genes. The upregulated genes are shown in green dots and the downregulated genes are shown in red dots. Nonsignificant genes are shown in grey dots.

Volcano plot presentation of differentially expressed genes. The upregulated genes are shown in green dots and the downregulated genes are shown in red dots. Nonsignificant genes are shown in grey dots.