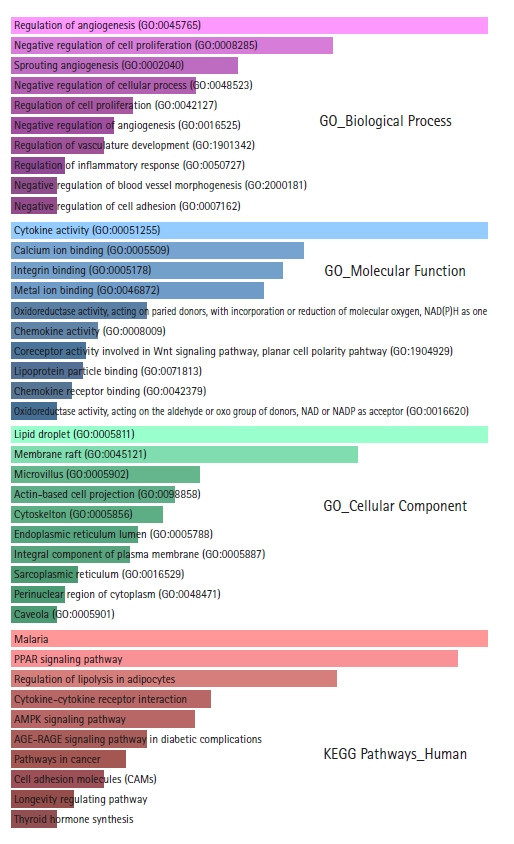
Fig. 2.

Bar graph representations of the top 10 Gene Ontology (GO) terms and enriched Kyoto Encyclopedia of Genes and Genomes (KEGG) pathways according to p-values. The pink bar graph represents GO biological processes, the sky blue bar graph represents GO molecular functions, the light green bar graph represents GO cellular components, and the light red bar graph represents enriched KEGG pathways.
