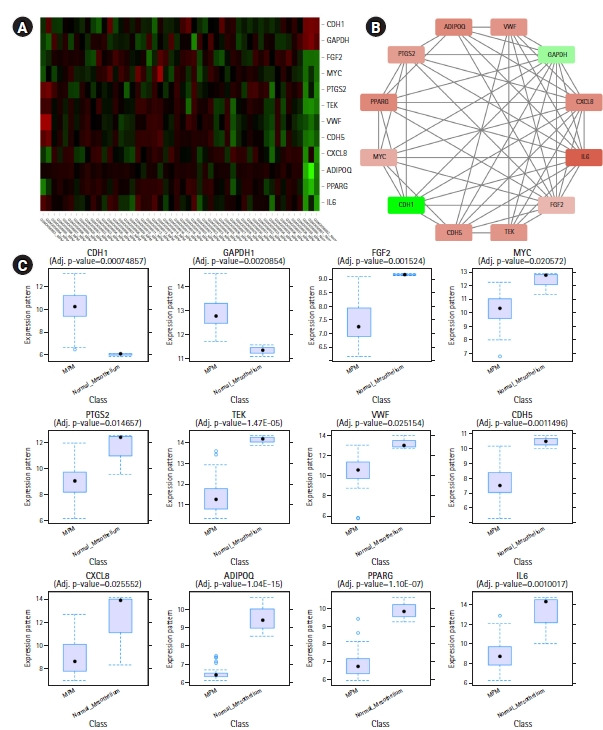
Fig. 5.

(A) Heatmap showing hub gene expressions in different samples of GSE112154. (B) Interactions among the common hub genes identified by 10 calculation methods of CytoHubba. (A, B) The downregulated genes are colored red and the upregulated genes are colored green. (B) The nodes are colored in a continuous manner according to their |log2FC| values. (C) Box plots showing expression levels of different hub genes in MPM (n = 47) and normal mesothelium (n = 3) samples.
