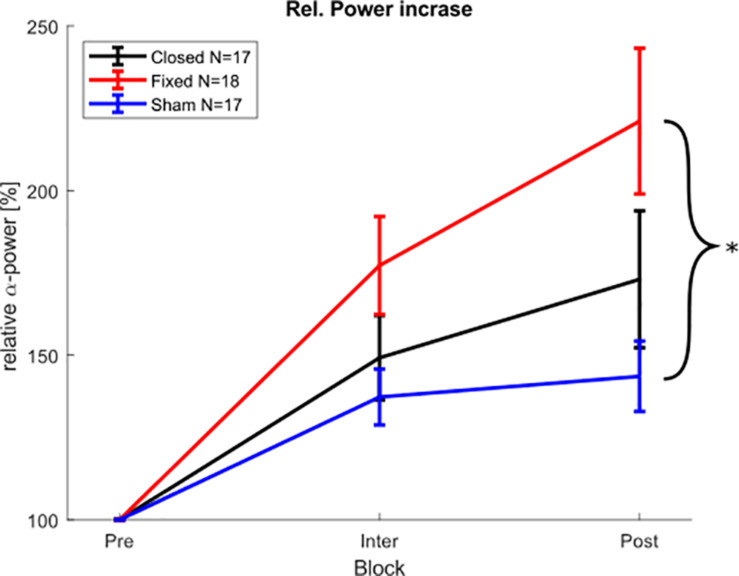
FIGURE 6.
Physiological aftereffect. Average posterior α-peak power during and after stimulation block, relative to pre-stimulation power. Error bars depict the standard error of the mean. The asterisk marks significant differences. The power during the stimulation block was calculated from the 150 stimulation free epochs between the stimulation epochs.

