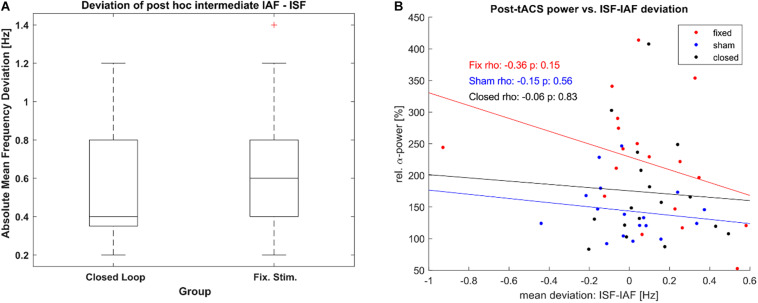
FIGURE 8.
Stimulation accuracy. (A) Boxplot of Frequency Deviation [mean absolute difference between estimated stimulation frequency (ISF) of each epoch and the determined α-frequency (IAF) as per post-hoc analysis] for both the closed loop tACS and the fixed frequency tACS group. Boxes mark the ends of the 25th and the 75th percentile of the samples’ distributions, the horizontal lines mark the median of each group. The whiskers correspond to +/–2.7σ of the data. (B) Correlation between relative posterior α-power post stimulation and the mean deviation between ISF and IAF during the intermediate unstimulated-epochs. One dot represents power and frequency-deviation values of a single participant. Lines show the least-square error lines per group.

