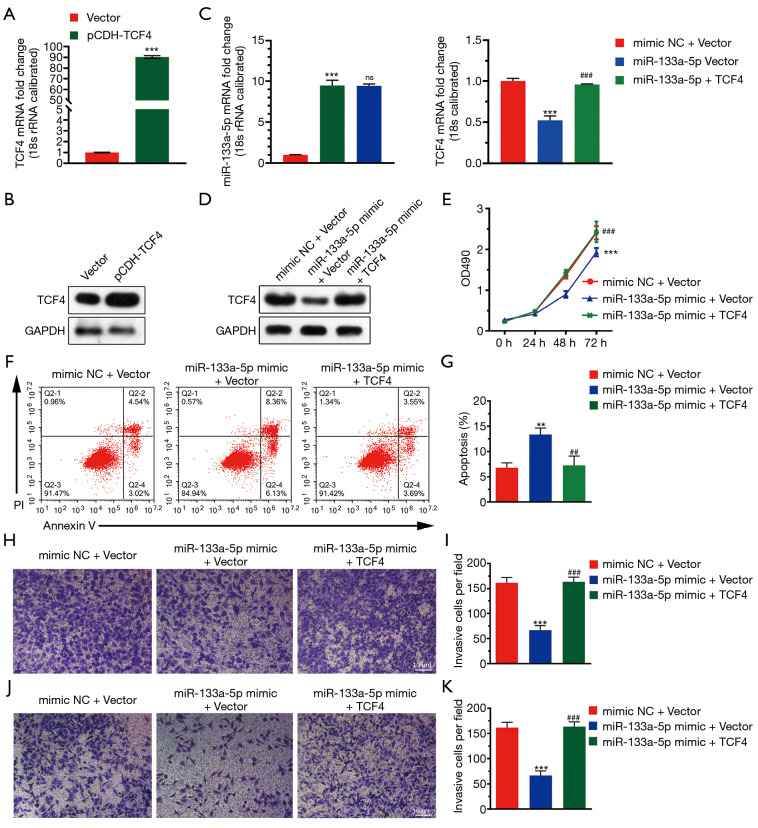
Figure 5.
TCF4 reverses the inhibitory effect of TCF-4. (A) The overexpression of TCF-4 mRNA level in GC cell lines was analyzed using qRT-PCR. A vector as the negative control. (B) The overexpression of the TCF-4 protein level in GC cell lines was analyzed using western blotting. A vector as the negative control. (C) The mRNA expression level of miR-133a-5p and TCF4 in cells transfected with miR-133a-5p-mimic and miR-133a-5p-inhibitor, respectively. (D) The protein expression level of miR-133a-5p and TCF4 in cells transfected with miR-133a-5p-mimic and miR-133a-5p-inhibitor was detected by the western blotting, respectively. (E) MTT assay detected cell proliferation. GC cells are transfected with miR-133a-5p mimics, miR-133a-5p inhibitor, or negative control siRNA. Twenty-four hours after transfection, the cells were stained with EdU and DAPI. (F) The representative picture that displays the PI-Annexin-V staining was used to stain the apoptotic cells in three transfected groups using the FACS assay. (G) Representative statistical analysis to display the percentage of the apoptotic cells in three transfected groups. (H,I) Representative images of the Transwell migration assay and histogram of migrating cells per field. The cells were stained with crystal violet. (J,K) Representative images of the Transwell migration assay and histogram of invasive cells per field. The cells were stained with crystal violet. **P<0.01 and ***P<0.001, ##P<0.01, ###P<0.001.

