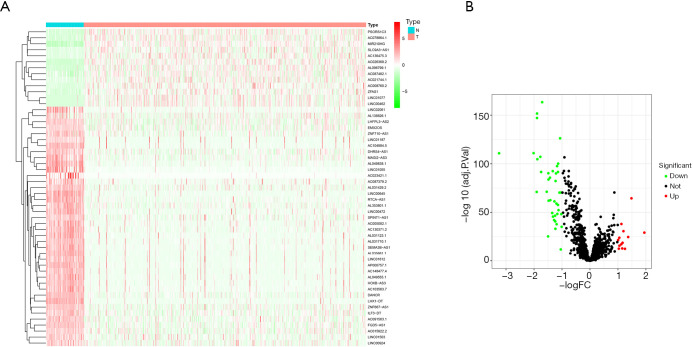
Figure 1.
Differential analysis of irlncRNAs. Heatmap of the top 50 upregulated and downregulated lncRNAs; blue and red represent low and high expression, respectively (A). Volcano plot of differential lncRNAs; green and red represent downregulated and upregulated lncRNAs, respectively (B). IrlncRNAs, immune-related long non-coding RNAs.

