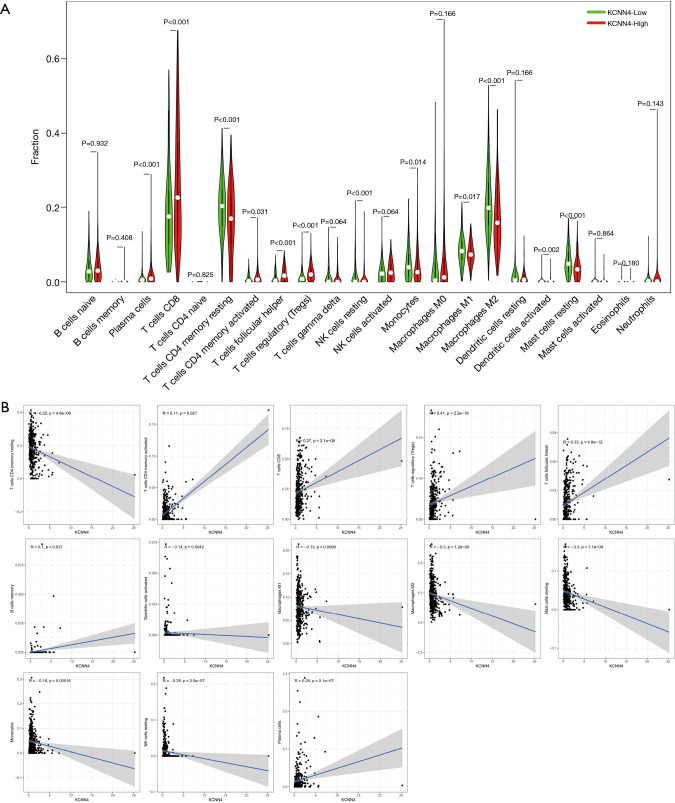
Figure 11.
Correlation between the relative proportion of TICs and KCNN4 expression. (A) Violin plot showing the difference in the proportion of 22 immune cells in KIRC tumor tissues for the high and low KCNN4 expression groups. (B) Scatter plot showing the correlation between the proportions of 13 TICs and the expression of KCNN4. TIC, tumor-infiltrating immune cell; KIRC, kidney renal clear cell carcinoma.

