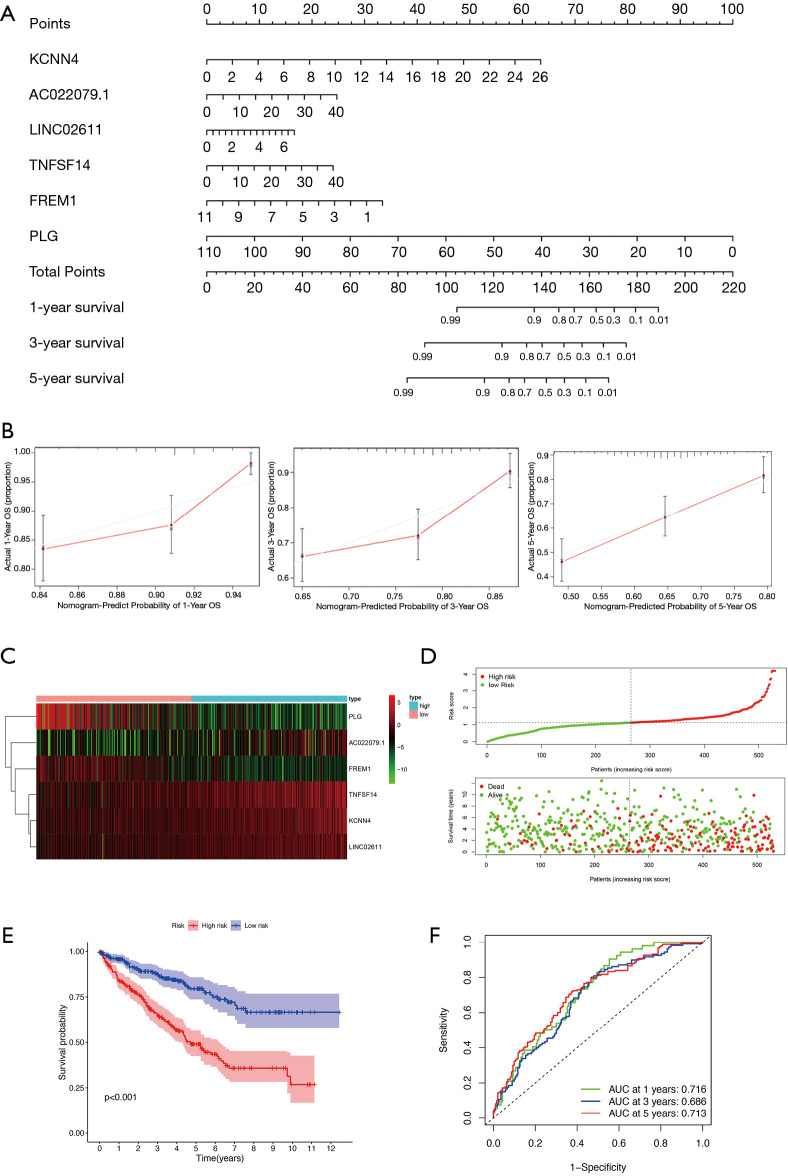
Figure 6.
Prediction model construction. (A) A nomogram for predicting the 1-, 3- and 5-year OS rate of KIRC patients based on six key genes. (B) Calibration curves for predicting patient survival rates at 1-, 3- and 5-years. (C) Heat map of the six genes in the prediction model. (D) The distribution of patients’ risk scores. (E) Kaplan-Meier analysis of KIRC patients with high and low risk scores. (F) Time-dependent ROC curves at 1-, 3- and 5-years. OS, overall survival; KIRC, kidney renal clear cell carcinoma; ROC, receiver operating characteristic.

